Student: Pietricica Andreea-Catalina
ACES Master
Remote Fish Feeder and Aquarium Water Monitoring
Project description
Gitlab Code : https://gitlab.com/AndreeaP/iot_fish_feeder/-/tree/main/
Web application: https://aquarium-fish-feeder.web.app/
Demo: Fish Feeder Video
The purpose of this project is to develop a simpler solution for aquarium maintenance using IoT devices. It has three features:
- To feed the fish automatically, with a customizable amount of food, whenever the owner desires and from any location
- To monitor water temperature every 8 hours
- To monitor water level every 2 days
The user has access to all these data and actions through a React based web application, connected to Firebase.
The project is built using an ESP32 development board, a servo motor, a water resistant temperature sensor and a water level sensor. The ESP32 board is also sending and receiving data to and from Firebase.
Hardware description
Components
- ESP32 development board
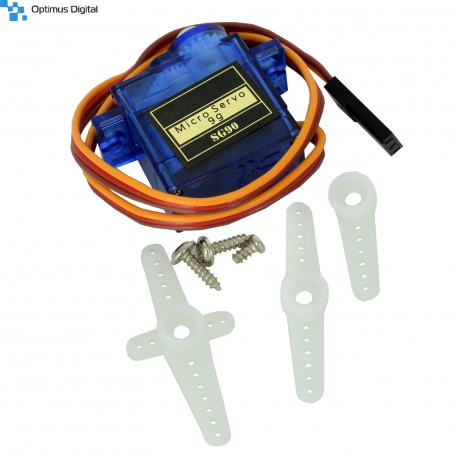
- Micro Servo Motor SG90
- Water level sensor
The sensor has ten exposed copper traces, five of which are power traces and the remaining five are sense traces. These traces are interlaced so that there is one sense trace between every two power traces. Normally, power and sense traces are not connected, but when immersed in water, they are bridged. (https://lastminuteengineers.com/water-level-sensor-arduino-tutorial/)
The more the sensor is sank in, the higher the output voltage in the S pin is.
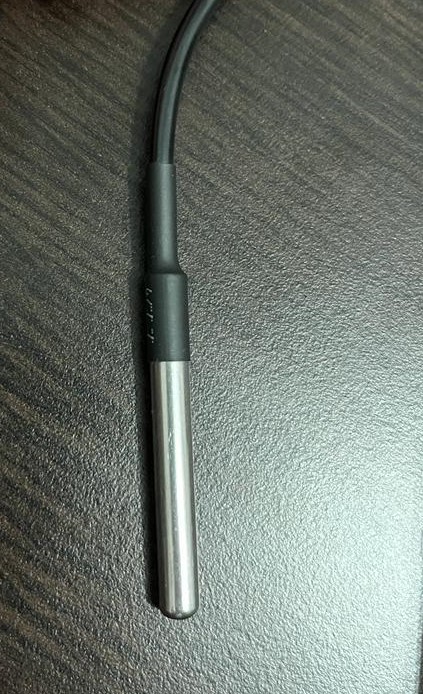
- Water resistant temperature sensor DS18B20 and a 4.7 kΩ resistor
Putting it all together:
The schematic was created using Fritzing program.
*Note: The purpose of the Arduino UNO board from this image is only for supplying a constant 5VDC voltage.
Project functionality
How it works
The feeding circuit
It is made using a servo motor and a recipient which has a hole at the bottom and a cover that is rotated in order to release the food. The motor rotates for 90°. It is activated when the ESP32 finds a change in the database in the servo/feed field.
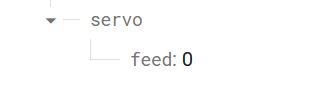
The value from servo/feed field from Firebase can be a number between 1 and 9, meaning the number of fixed quantities of food to be released. After one release, 5 more seconds will pass before the second release, in order to give the fish enough time to eat.
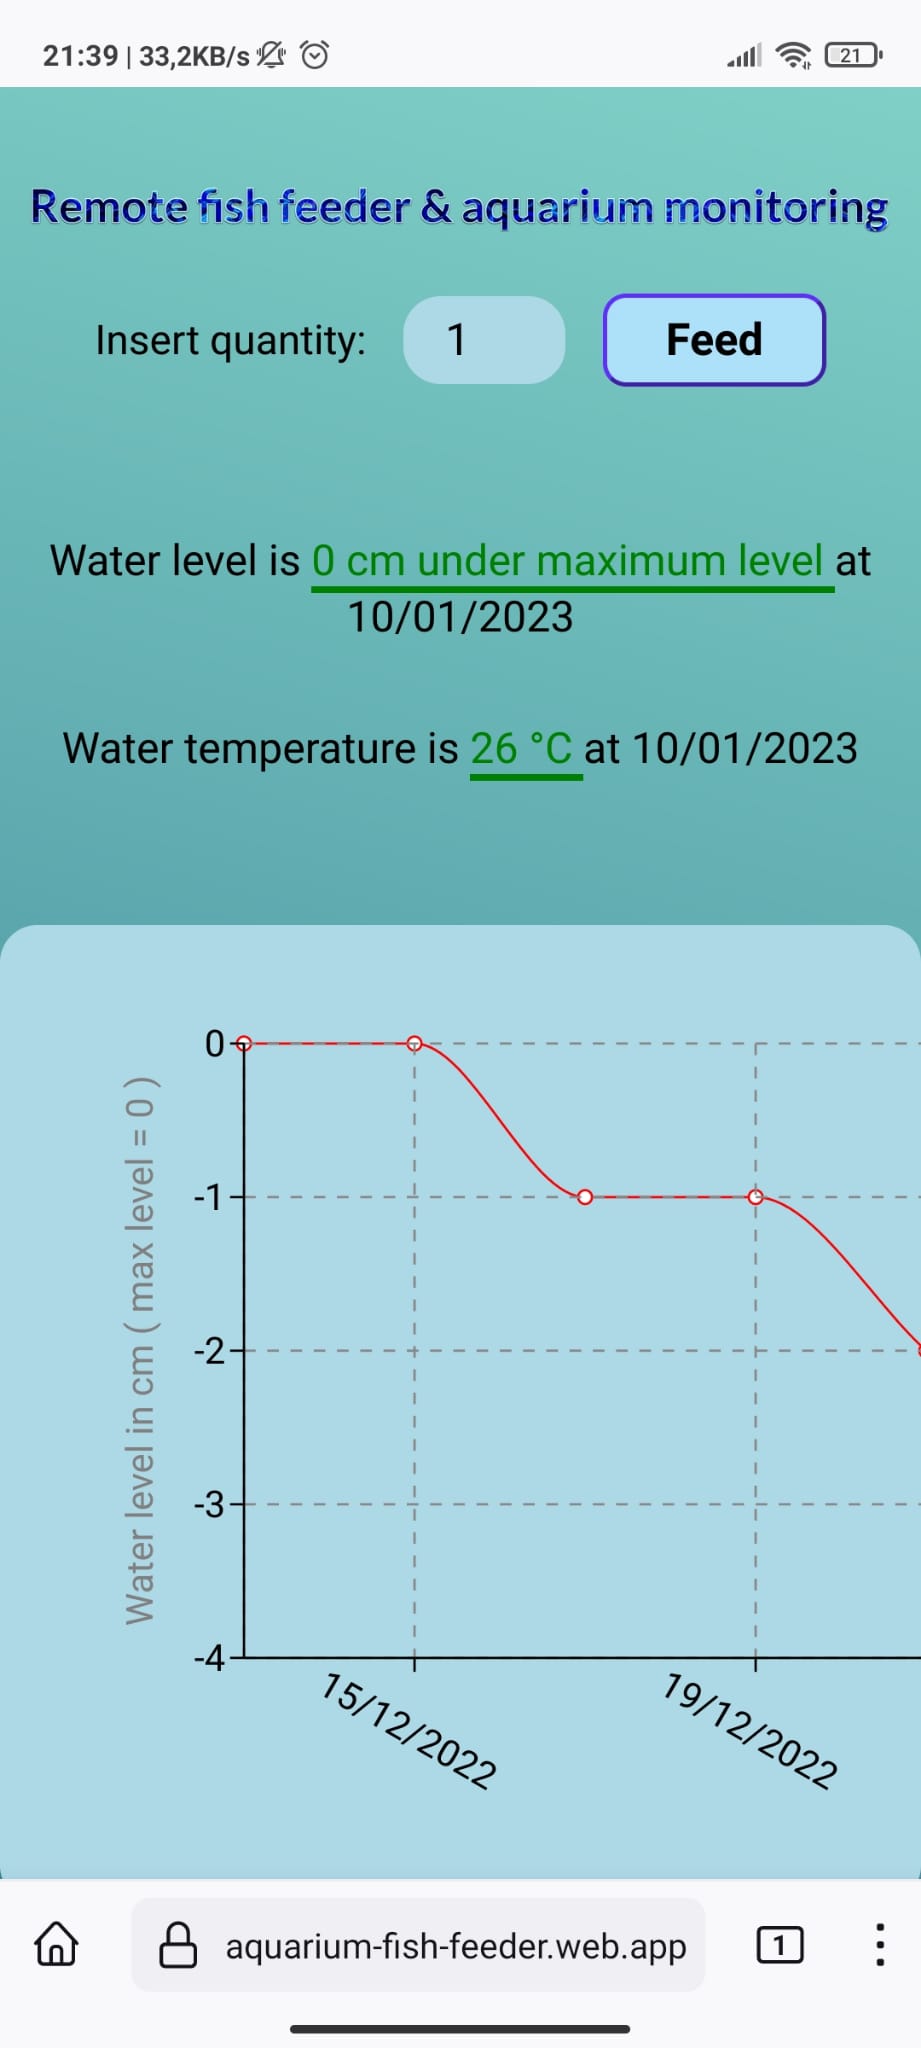
The quantity can be written in the box (see image) from the web application and then updated in the database. The value 1 is set as default, so if the user wants this way, he just has to press the Feed button, without writing anything.
As the Feed button is pressed, a “Feeding in progress” message shows up.
After finishing the action, the ESP will write 0 in the database. Then, in the web application, the message “Feeding successful” appears.
If the ESP32 hasn’t reset the data, the message “Feeding failed” will show up.
Also, if the number inserted is greater than 9, an error message will be displayed.
The entire process is described by the following diagram
Water temperature monitoring
The water temperature monitoring circuit is composed of the temperature sensor and a 4.7 kΩ resistor. The ESP32 reads data from this sensor every 8 hours. It enables a power pin for the sensor, reads the data, and then disables the power pin. This is done in order to reduce power consumption and for the sensor not to be continuously powered.
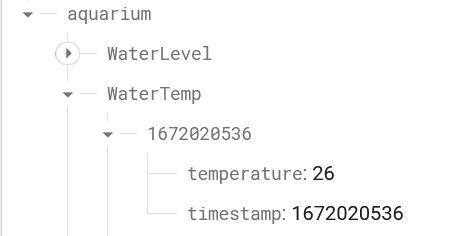
The temperature value is then sent to Firebase and updated in the WaterTemp field, together with the corresponding timestamp.
In the web application, there is a section where the last registered value is displayed, also with the day when the measurement was done.
If the temperature value is good (between 25°C and 27 °C), it will be displayed in green. If it is a little low (21°C -24°C), it will be yellow, else, if it is a critical value, the message will be red.
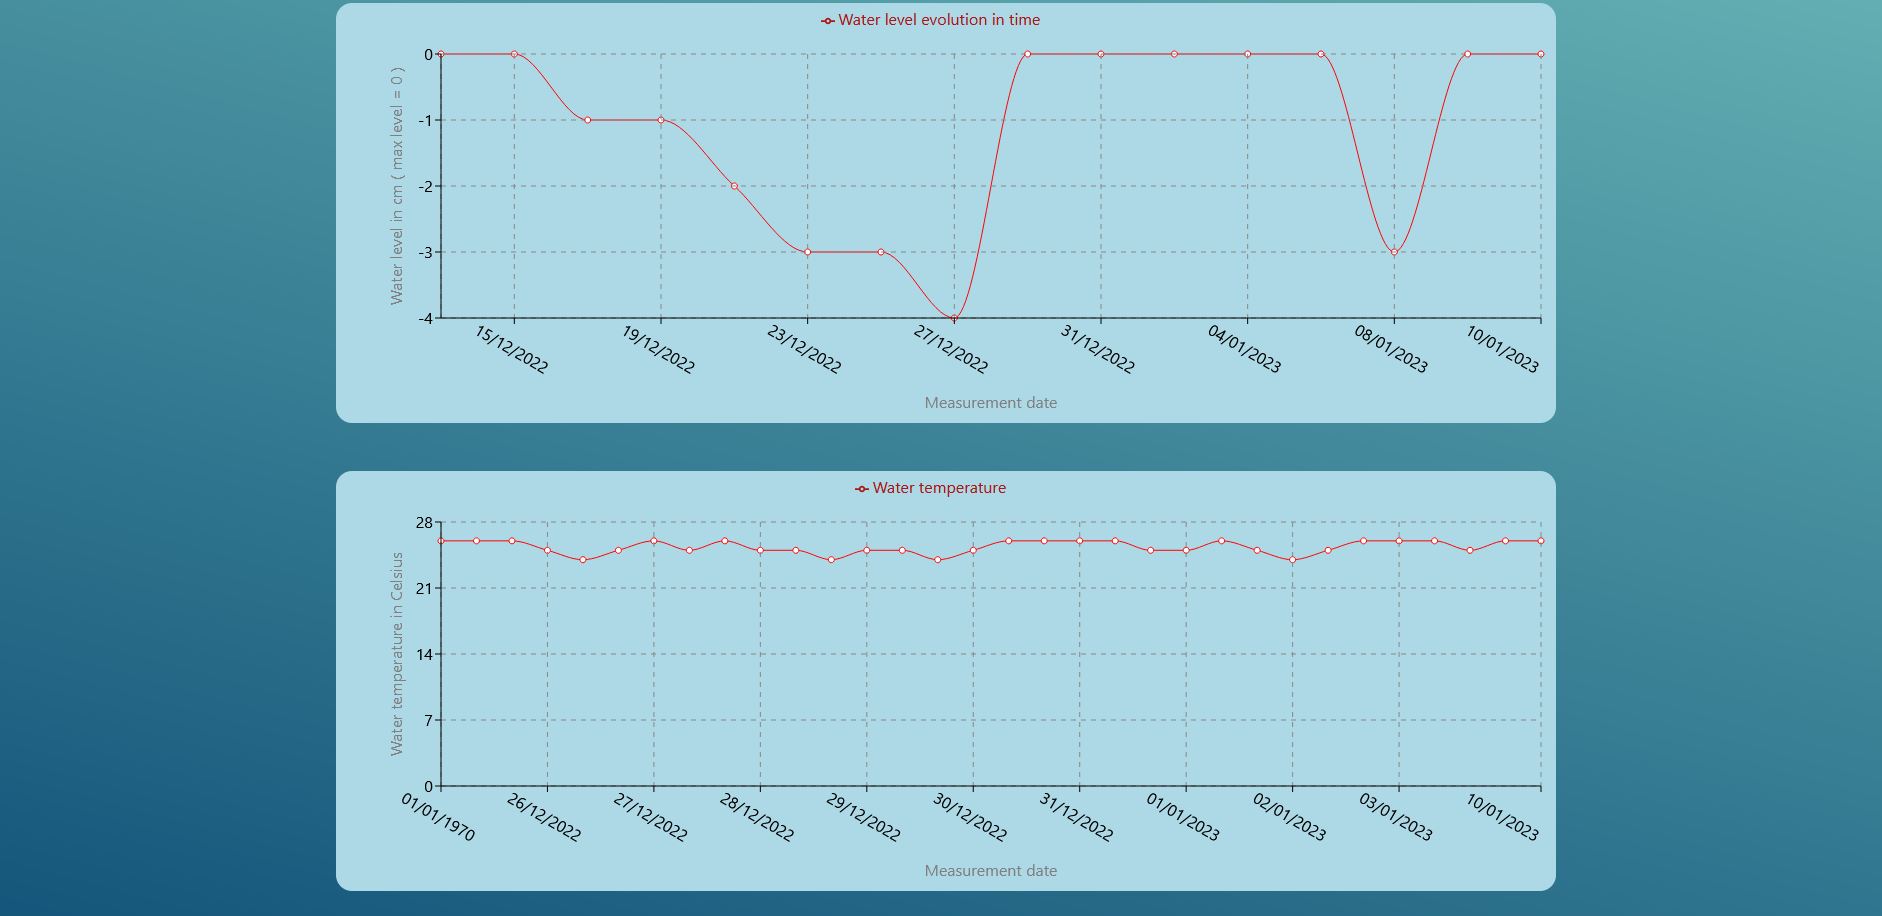
More, history of the temperature values is displayed in the web page - a graphic that shows the evolution of the temperature over time.
The water temperature monitoring process is described by the following diagram.
Water level monitoring
The water level monitoring circuit is performed using the water level sensor. It sends to the ESP32 a value that is proportional with the depth to which it is submerged. This value is transformed in the code in cm, to indicate the depth. The sensor value intervals for each centimeter was previously measured, performing a calibration.
The level in cm value is then sent to Firebase and updated in the WaterLevel field, together with the corresponding timestamp.
In the web application, there is a section where the last registered value is displayed, also with the day when the measurement was done. It is expressed as a number of centimeters below the maximum level. So, at first, when the tank is filled with water, the sensor measuring part must be completely sank. In this way, the user can know how close the water level is to the water filter, in case he is away for a long time. It is important for the water filter to not function in the air, because it will be damaged.
An important detail is that the sensor has only 4 centimeters.
If the level value is good no more than 2 cm under max level), it will be displayed in green. If it is a little low (3 cm under max level), it will be yellow, else, if it is a critical value (4 cm), the message will be red.
More, history of the level values is displayed in the web page - a graphic that shows the evolution of the level over time.
The water level monitoring process is described by the following diagram.
The web application is also available on mobile format. The graphs are bigger than the screen size, but they are horizontally scrollable.
Software description
For the implementation of this project the following software tools were necessary:
For the web application:
- Visual Studio Code
- Node.js
- Note.js Extension Pack for VS Code
- Firebase tools
- React
Instructions:
- Install Node.js and Node.js extension Pack for VS Code - https://randomnerdtutorials.com/esp32-firebase-web-app/#install-nodejs
- Install Firebase tools
npm -g install firebase-tools
- Install react
npm i react
- Generate node modules (in order to have all the necessary dependencies)
npm install
- Firebase login
firebase login
- Build the application
npm run build
- Deploy the application
firebase deploy --only hosting:aquarium-fish-feeder
For the ESP32 application:
- Arduino IDE
- ESP32 library for Arduino IDE (https://randomnerdtutorials.com/installing-the-esp32-board-in-arduino-ide-windows-instructions/)
- Firebase-ESP-Client Library for Arduino IDE
- OneWire and DallasTemperature libraries for Arduino IDE
The web application
The web application was implemented in JavaScript using React library. The main advantages of using this library are that it makes JavaScript coding easier, provides developer tools and structures the application into components.
The functions created using React and Firebase tools permitted the monitoring of the database changes. In this way, when a new value appears in the database, the effect is seen immediately in the web page. The charts are also updated with the new values of level and temperature. Also, by sending the feed data to Firebase and then waiting for that value to be changed by the hardware components, made it possible to display the messages “Feeding successful/failed”. The component FishFeeder.jsx contains the implementation for all the described functionalities. The charts are created using recharts React library.
The application is hosted by the Firebase platform.
The Arduino application
The Arduino application consists in three main parts:
- The feeding functionality - detects changes to the database and based on that value, activates the pin that controls the servomotor, in such way that the food will fall from the container, then it switches it back. If this value is greater than 1, the container will stay closed for 5 seconds before the servomotor gets activated the second, the third etc. time.
- The water temperature monitoring part - in these part the value from the temperature sensor is read using the OneWire library. This is done every 8 hours, using a time delay variable that stores the value in milliseconds. To prepare for reading the value, the ESP32 activates at first the power pin for that sensor. After reading, it gets deactivated. The temperature is then sent to the database, together with its timestamp.
- The water level monitoring part - in these part the value from the level sensor is read as raw value. This value is transformed based on 4 different ranges obtained experimentally, defining each one a level of 1 centimeter. This is done every 2 days, using a time delay variable that stores the value in milliseconds. To prepare for reading the value, the ESP32 activates at first the power pin for that sensor. After reading, it gets deactivated. The level value is then sent to the database, together with its timestamp.
Problems
- The water level senor is small. It can only detect if the water level decreases with maximum 4 centimeters.
- The water level has a low sensitivity. It registers very different values for the same depth, when performing multiple measurements.
Conclusions
The remote fish feeder and aquarium water monitoring system is a very useful device, that makes for people easier to maintain an aquarium, especially for long periods of time when they are not home. As about the project development, I consider it a very interesting activity, mainly because of the knowledge I gathered during this process: working with Firebase, controlling hardware components remotely and also creating web applications. The project still can be improved, but it represents a great starting point in developing IoT applications.
Resources
https://esp32io.com/tutorials/esp32-temperature-sensor
https://esp32io.com/tutorials/esp32-water-sensor
https://randomnerdtutorials.com/esp32-ds18b20-temperature-arduino-ide/
https://randomnerdtutorials.com/control-esp-gpios-firebase-web-app/
https://randomnerdtutorials.com/esp32-firebase-web-app/#install-nodejs
https://www.javatpoint.com/reactjs-tutorial
https://randomnerdtutorials.com/installing-the-esp32-board-in-arduino-ide-windows-instructions/
