Intel OneAPI Toolkits
Intel OneAPI Toolkits is a software development product that facilitates native code development on Windows and Linux in C++/C and Fortran for parallel computing. Parallel programming enables software programs to take advantage of multi-core processors from Intel and other processor vendors. It can be downloaded here:
https://www.intel.com/content/www/us/en/developer/tools/oneapi/toolkits.html#gs.v2ennr
You should consider Intel® oneAPI Base Toolkit and Intel® oneAPI HPC Toolkit for your experiments.
Below you find a description of the old version of Parallel Studio. Please check the latest documentation from Intel for updated information!
The Toolkit is composed of several component parts, each of which is a collection of capabilities:
- Intel Parallel Composer
- Intel C++ Compiler with Cilk Plus and OpenMP;
- Intel Fortran Compiler with OpenMP;
- IDE plug-in integration with Visual Studio and Eclipse;
- Debugging via Visual Studio Debugger extensions, GNU Debugger extensions;
- Intel Integrated Performance Primitives (IPP), Intel Math Kernel Library (MKL) and Threading Building Blocks (TBB) libraries;
- Intel Data Analytics Acceleration Library (DAAL).
- Intel Parallel Advisor helps programmers decide where to parallelize their code, and whether the resulting performance gain will be worth the effort.
- Intel VTune Amplifier is a performance profiler that analyzes hotspots, concurrency and locks-and-waits.
- Intel Parallel Inspector improves reliability by identifying memory errors and threading errors.
Finding hotspots
Using Intel VTune Amplifier
- Open Intel VTune Amplifier. From the local terminal connect to fep.grid.pub.ro using ssh
ssh -X fep.grid.pub.ro -l user_cs_curs_pub_ro
$ qlogin -q ibm-dp.q
then type
module load utilities/intel_parallel_studio_xe_2016
to load Intel module. This script sets the PATH environment variable that specifies locations of the product graphical user interface utility and command line utility. After this, open VTune with the command:
AMPLXE_MORE_PIN_OPTIONS='-ifeellucky' amplxe-gui
- Create a performance baseline for the application
- Create a new project. Using New > Project, specify a project name. This will create a project directory under $HOME/intel/amplxe/projects and will open the Choose Target and Analysis Type window with the Analysis Target tab active. From the left pane, select the local target system and from the right pane select the Application to Launch target type from the drop-down menu. For the Application field browse to the directory where you compiled the application and choose tachyon_find_hotspots. For the Application parameters field, make the same step and choose the file balls.dat from the directory dat. After filling those two fields, click on the Choose Analysis button on the right to switch to the analysis type configuration.
- Run an analysis. From the analysis tree on the left, select Algorithm Analysis → Basic Hotspots. The right pane is updated with the default options for the Basic Hotspots analysis. Click the Start button on the right command bar. VTune Amplifier launches the executable that takes the input and renders an image displaying the execution time before exiting. VTune Amplifier finalizes the collected data and opens the results.
- Interpret Results
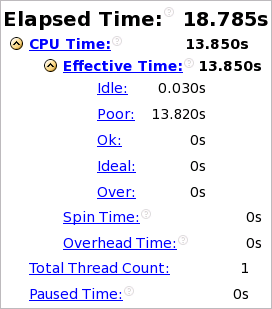
- Basic Hotspot Metrics. Start analysis with the Summary window. To interpret the data, hover over the question mark icons to read the pop-up help and better understand what each performance metric means. Note that CPU Time for the sample application is equal to 13.850 seconds. It is the sum of CPU time for all application threads. Total Thread Count is 1, so the sample application is single-threaded. The tachyon_find_hotspots application ran mostly on one logical CPU. If you hover over the highest bar, you see that it spent 14.320 seconds using one core only, which is classified by the VTune Amplifier as a Poor utilization for a multicore system. To understand what prevented the application from using all available logical CPUs effectively, explore the Bottom-up pane.
- The Top Hotspots section provides data on the most time-consuming functions (hotspot functions) sorted by CPU time spent on their execution.
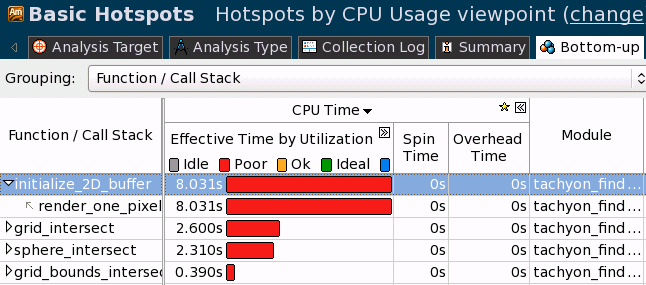
- For the sample application, the initialize_2D_buffer function, which took 8.031 seconds to execute, shows up at the top of the list as the hottest function.
- The Others entry at the bottom shows the sum of CPU time for all functions not listed in the table.
- The CPU Usage Histogram represents the Elapsed time and usage level for the available logical processors.
- Analyze the Most Time-consuming Functions. Click the Bottom-up tab to explore the Bottom-up pane. Analyze the CPU Time column values. This column is marked with a yellow star as the Data of Interest column. It means that the VTune Amplifier uses this type of data for some calculations (for example, filtering, stack contribution, and others). Functions that took most CPU time to execute are listed on top. The initialize_2D_buffer function took the maximum time to execute,8.031 seconds, and had the longest poor CPU utilization (red bars). This means that the processor cores were underutilized most of the time spent on executing this function. To get the detailed CPU usage information per function, use the Expand button in the Bottom-up pane to expand the CPU Time column. To get the detailed CPU usage information per function, use the Expand button in the Bottom-up pane to expand the CPU Time column.
- Analyze Code The hottest function in the application is initialize_2D_buffer. Use the Source/Assembly buttons to toggle the Source/Assembly panes on/off. Assembler instructions are grouped by basic blocks. The assembler instructions for the selected hotspot function are highlighted. To get help on an assembler instruction, right-click the instruction and select Instruction Reference. When you identify a hotspot in the serial code, you can make some changes in the code to tune the algorithms and speed up that hotspot. Another option is to parallelize the sample code by adding threads to the application so that it performs well on multi-core processors. By default, when you double-click the hotspot in the Bottom-up pane, VTune Amplifier opens the source file positioning at the most time-consuming code line of this function. For the initialize_2D_buffer function, this is the line used to initialize a memory array using non-sequential memory locations.
- Tune Algorithm Modify the initialize_2D_buffer in order to initialize the memory array using sequential memory locations.
- Compare with previous results Select the result in the Project Navigator, right-click and choose Compare Results from the context menu. Specify the Basic Hotspots analysis results you want to compare and click the Compare Results button. In the Summary window, you should see that the Elapsed time shows 7.842 seconds of optimization for the whole application execution. The Top Hotspots section should show the gain in performance for the most critical functions. Switch to the Bottom-up window to compare the two results and see the differences per metrics side by side.
![]() If you encounter a compare error related to a lock on the database, close the views/tabs for the analysis.
If you encounter a compare error related to a lock on the database, close the views/tabs for the analysis.
Extra: Analyzing locks and waits
In this part, we will use the sample application called “tachyon_analyze_locks” and will guide you through basic steps required to analyze a source code for locks and waits, when implementing a multithreaded application.
1. Open Intel VTune Amplifier. Open VTune with the command
amplxe-gui
2. Create a new project.
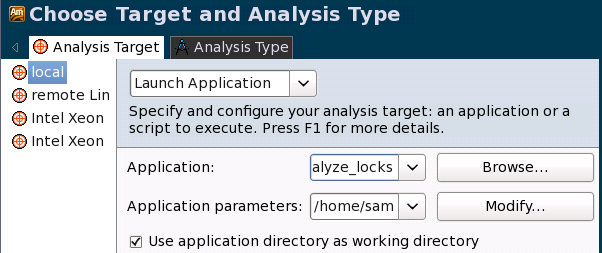
Using New > Project, specify a project name. This will create a project directory under $HOME/intel/amplxe/projects and will open the Choose Target and Analysis Type window with the Analysis Target tab active. From the left pane, select the local target system and from the right pane select the Application to Launch target type from the drop-down menu. For the Application field browse to the directory where you compiled the application and choose tachyon_analyze_locks. For the Application parameters field, make the same step and choose the file balls.dat from the directory dat. After filling those two fields, click on the Choose Analysis button on the right to switch to the analysis type configuration.
3. Run an analysis. From the analysis tree on the left, select Algorithm Analysis > Locks and Waits. The right pane is updated with the default options for the Locks and Waits analysis. Click the Start button on the right command bar. VTune Amplifier launches the executable that takes the input and renders an image displaying the execution time before exiting. VTune Amplifier finalizes the collected data and opens the results in the Locks and Waits viewpoint.
4. Interpret result data
a) Analyze the Basic Locks and Waits Metrics.
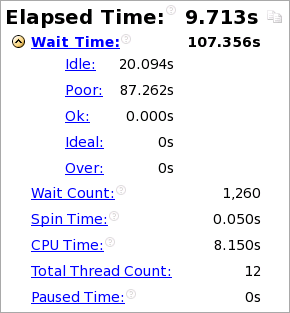
The Result Summary section provides data on the overall application performance per the following metrics:
- Elapsed Time is the total time the application ran, including data allocation and calculations;
- Wait Time occurs when software threads are waiting due to APIs that block or cause synchronization. Wait Time is calculated per thread, so the total Wait time may exceed the application Elapsed time. Expand the Wait Time metric to view a distribution per processor utilization levels. In the sample application, most of the Wait time is characterized with an ineffective processor usage;
- Wait Count is the overall number of times the system wait API was called for the analyzed application;
- Spin Time is the time a thread is active in a synchronization construct; the current value exceeds the threshold, so it is classified as a performance issue and highlighted in pink;
- CPU Time is the sum of CPU time for all threads;
- Total Thread Count is the number of threads in the application;
- Paused Time is the amount of Elapsed time during which the analysis was paused via GUI, CLI commands, or user API.
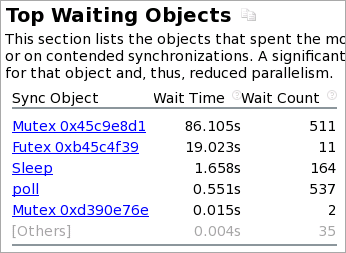
For the tachyon_analyze_locks application, the Wait time is high. To identify the cause, you need to understand how this Wait time was distributed per synchronization objects. The Top Waiting Objects section provides the list of synchronization objects with the highest Wait Time and Wait Count, sorted by the Wait Time metric.
The Thread Concurrency Histogram represents the Elapsed time and concurrency level for the specified number of running threads. Ideally, the highest bar of your chart should be within the Ok or Ideal utilization range.

Note the Target Concurrency value. By default, this number is equal to the number of physical cores. Consider this number as your optimization goal.
The Average metric is calculated as CPU time / Elapsed time. Use this number as a baseline for your performance measurements. The closer this number to the number of cores, the better. For the sample code, the chart shows that tachyon_analyze_locks is a multithreaded application running maximum 10 threads simultaneously on a machine with 12 cores. But it is not using available cores effectively. The Average Concurrency on the chart is about 0.8 while your target should be making it as closer to 12 as possible (for the system with 12 cores). Hover over the second bar to understand how long the application ran serially. The tooltip shows that the application ran one thread for almost 7.8 seconds, which is classified as Poor concurrency.
The CPU Usage Histogram represents the Elapsed time and usage level for the logical CPUs. Ideally, the highest bar of your chart should be within the Ok or Ideal utilization range.

The tachyon_analyze_locks application was either idle or ran mostly on one logical CPU. If you hover over the second bar, you see that it spent 5.651 seconds using one core only, which is classified by the VTune Amplifier as a Poor utilization. To understand what prevented the application from using all available logical CPUs effectively, explore the Bottom-up pane.
b) Identify locks Click the Bottom-up tab to open the Bottom-up pane. For the analyzed sample code, you see that the first synchronization object caused the longest Wait time. The red bar in the Wait Time column indicates that most of the time for this object processor cores were underutilized. It is a Mutex that shows much serial time and is causing a wait. Click the arrow sign at the object name to expand the node and see the draw_task wait function that contains this mutex and call stack. Double-click this wait function to see the source code.
5. Analyze the source code
For the sample code, the VTune Amplifier highlights the line entering the rgb_mutex mutex in the draw_task function. The draw_task function was waiting for almost 86 seconds while this code line was executing and most of the time the processor was underutilized. During this time, the critical section was contended 511 times.

The rgb_mutex is the place where the application is serializing. Each thread has to wait for the mutex to be available before it can proceed. Only one thread can be in the mutex at a time. We need to optimize the code to make it more concurrent.
6. Solve the problem and test it Open the source file called src/linux/analyze_locks/analyze_locks.cpp. The rgb_mutex was introduced to protect calculation from multithreaded access. The brief analysis shows that the code is thread safe and the mutex is not really needed. To solve the issue, comment the lines that use the mutex and disable it, save it and rebuild the application.
Run tachyon_analyze_locks as follows:
./tachyon_analyze_locks dat/balls.dat
System runs the tachyon_analyze_locks application. Note that execution time reduced from 11.632 seconds to 0.800 seconds.


