Lab 0xC4: Digital Debugging
Like in all engineering work, bugs can and will appear in embedded systems.
How Is It Different from Usual Debugging?
The reason for which embedded debugging is more difficult than common software debugging arise from multiple issues:
- The newcomer is used to high level tools: e.g. fancy IDEs, fancy debuggers, etc. For embedded, many times this is different because you might not have these tools (e.g. due to custom HW).
- If you don't have a specialized debugger and try to use a generic one (say Remote GDB), what makes you think that you have the network stack required to use that debugger? If you did implement such a stack, how sure are you that it does work properly?
- Even if you did have a specialized debugger (e.g. a Lauterbach Probe), most likely you will need specialized configurations for your debugger, in order to work with your hardware (e.g. Practice Scripting Language for Lauterbach T32).
- Even if you did have the tools, you are (usually) at a far lower level of abstraction, meaning that your usual thought patterns don't hold anymore, since what you can assume and what you can't is different at such a low level.
- Invasive debugging might affect the behaviour of your code - think about RTOSes (real-time operating systems), SMP (multiprocessor systems), or of your circuit (e.g. modify circuit to measure current intensity).
- Your hardware might have bugs.
- Even your print might not work, since sometimes you have to implement such a function and it might have bugs itself.
Nonetheless, the principles of debugging are just the same as in higher level software: You have to compare what your mental model of the code/circuit is supposed to do with what it actually does, and in order to check what it actually does you need visibility.
Tools of the Game
Visibility at hardware level is achieved through some form of IO (if available):
- printf on UART - print using LCD, bluetooth, putty, etc.
- LED debugging - check condition true/false
- Advanced debuggers for memory/register dump & modifications, clock control, etc - see JTAG below
- Loopbacking (connecting outputs to inputs) can provide insights into how your code is received by the external device to which it is connected.
and through measuring instruments:
- Multimeters (for static values)
- Resistance: Just place the piece of circuit between the probes.
- Tension: connect in parallel - positive probe to the higher potential point, negative probe to lower potential point (otherwise would show negative value - no danger). For pontential at a single point: negative probe at GND, positive probe at your point.
- Current: connect in series.
- Always start with worst expectations: set the scale of the multimeter to maximum then progressively drop the scale until you have most accurate measurement. This prevents the magic smoke from coming out.
- To check diode polarization: Select diode check on the multimeter. When negative probe on anode and positive on cathode, the multimeter makes a sound.
- To check for short circuits: Use diode check on the multimeter - hearing a sound means short circuit.
- To check for connectivity: Use diode check on the multimeter - hearing a sound means you have connectivity.
- Oscilloscopes (for dynamic values - Electroboom explains it better than us)
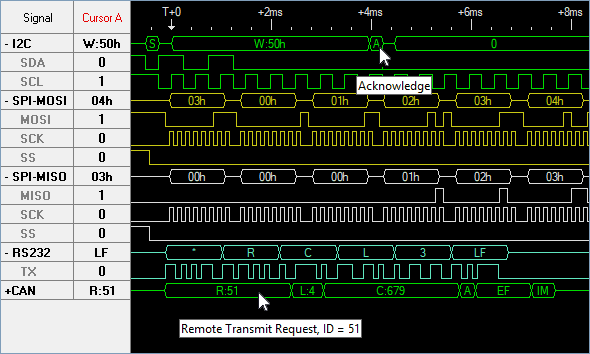
- Logic Analyzers (for digital signals) - they mostly look and behave as the wave forms results of simulations in Xilinx FPGA Tools.
- Protocol Analyzers (for embedded protocols such as I2C, SPI, etc.) - Logic Analyzers aware of the protocol
- JTAG-based debuggers - can be very advanced: dump memory at given location, possible kernel awareness, clock stop, memory and register access (read/write), etc.
Since we don't consider that debugging skills is something that can be taught/understood/achieved through theoretical means, we provide you with a broken device and ask you to fix it :).
At the end of the practical session, we'll wrap up with conclusions about what you just did to fix the given device.
Example of Debugging Flow
When debugging, it is always best to have an organised approach.
One example of debugging flow might be the following:
- Double check the datasheet and the schematic. Do we access the right registers? Are the peripherics connected to the pins to which we thought they are?
- Try JTAG-based debuggers or any debugger that you know works with your device.
- You might consider printf debugging:
- Do you have an ethernet stack? If yes, consider SSH, NFS, etc to achieve printf debugging.
- If no network stack, we default to simpler protocols: what about UART? Can we connect anything over UART? Maybe a PC, HC-05 Bluetooth Module, LCD?
- If up to now we get no insights, we might consider LED debugging to track the execution flow before moving to HW debugging.
- If all else failed, do HW debugging: Do you see any (obvious) issues with the HW design or with the schematic?
- Start isolating the issue using measuring instruments: multimeters, osciloscopes, logic analyzers depending on the scenario.
Obviously, this list is not necessarely something well established in the industry or the academia. There might be things missing or which don't apply depending on the project you work on.
Tasks
The purpose of the device is to trigger an alarm message on the terminal in case the temperature of the environment is above 40 C for more than 10 measurement in a row. The SW and/or the HW is broken. Your task is to fix it.
The broken device is available here: lab0xc4-skel.tar.gz
- Load the schematics and the binary. Run the simulation. Check how it behaves. Is it the way it should?
- Maybe the number of above the limit temperatures is not enough to trigger the alarm. Try to find out what value does that counter has.
- If you were unable to find out what is the value of the counter, multiple possible problems that come in mind might be: the output device is broken (I don't think so, it is from the Proteus Library), the controller is broken (again, I don't think so, since it is from Proteus Library), the HW interconnect is broken (that might be true), the SW interconnect is broken (that might be true as well), our code is broken (that might also be true). Let's check for problems in our code: Is the point right before the print to virtual terminal reached? How can you figure out this information?
- If not reached, do we have the correct interrupt vector? Did we instruct the ADC to trigger the interrupt?
- If it was reached, maybe there is a problem with our schematics. Let's look more closely to what happens between the uC and the virtual terminal. Try to use a logic analyzer for this. A scale of 0.43m should show the UART frames clearly (if any).
- It seems that nothing happens. What can be the cause? It seems that the print function is not working properly. Check that out!
- Now that it seems that the USART is fixed, let's try to run the simulation again. Is the message finally printed? Is there, at least anything printed?
- If it didn't look the way it should, try to figure out why. Try to estimate the baudrate from the logic analyer waveform. Is the baudrate the one expected by the virtual terminal? How can you figure that out? Adjust the baudrate (from the code) accordingly.
- At this point, you should have a reliable connexion to the virtual terminal (so you can use printf - finally). Is the alarm counter incresing?
- What is the actual voltage value given as output by the temperature sensor? What instruments can you use to see it? Is the temperature sensor properly connected? Take a look in the datasheet of the sensor . Do the necessaire HW modifications to get the right results. How did the potential on the pin change?
Conclussions
- Binary values can always be checked by using an LED / GPIO port.
- If possible, you can use the UART port to have access to a printf-like function to debug your code.
- You can use a logic analyzer to inspect digital wave forms, check some timing constraints, including protocols such as UART, I2C, etc.
- For HW bugs, you can use measurement instruments to inspect your circuit (voltage, check for connectivity, etc.)
- For HW bugs, it is always a good idea to check the schematics and the datasheet.
- Keep in mind that at this level of abstraction both HW and SW bugs can appear.
- Double check against the datasheet that your SW configurations are correct.
- Don't assume that there is any commodity: IO might be broken, printf might be broken, communication stacks might be broken, HW might be broken, there are no memory protections in bare-metal programming, etc.
* Author: Dorin Ionita


