An Actual Galileo application: An EKG Device
Objectives
- Discover what EKG is and its significance as a medical application
- Introduce the
SHIELD-EKG-EMGboard from Olimex - Learn how to do basic Digital Signal Processing
Signals
So far we've examined analog values, voltages measured at pins A0-A7 of the microcontroller. If we measure multiple times the same voltage we obtain a range of values called a “signal”. A signal contains information about the variation in time of the measured quantity. We should take a very short look at what we can do with signals:
* Amplification: Taking a “small” signal, we can “enlarge”. This is akin to multiplication, since each individual value is multiplied by a factor, also called gain. But what if the signal is noisy? The noise is amplified as well!
EKG
An Electrocardiogram is a method of measuring the electrical activity of the heart over a period of time, by attaching electrodes to the surface of the skin and measuring electric potential between them. The EKG abbreviation comes from the German term elektrokardiogramm, denoting this method. EKGs are used to determine regularity of heartbeats and damage to the heart. It is a quick, non-invasive method of monitoring heart activity of a patient.
The phenomenon that enables this method is the depolarization of the heart muscle during each heartbeat. Normally each muscle cell has a negative charge on its surface, but this is increased at contraction. During a heartbeat, the heart goes through a process of gradually contracting heart chambers, and this is seen externally as variations of voltage between electrodes placed on either side of the heart.
Electrodes
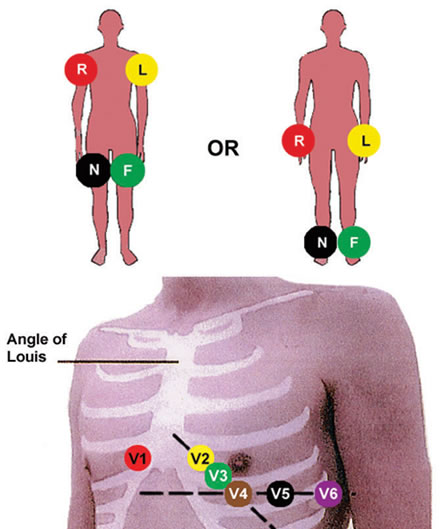
Usually more than two electrodes are used: Each pair of electrodes would form a *lead*, that is, a voltage difference that can be represented on a display or on paper as a signal and can be investigated. Common EKG systems can be single-lead, 3-lead, 5-lead or 12-lead. Electrodes forming these pairs have standardized positions and labels, as in the following table (ommited some) and figure:
| Electrode label | placement |
|---|---|
| RA | Right arm |
| LA | Left arm |
| RL | Right leg, lateral calf muscle |
| LL | Left leg, same location as right leg |
| V1 | 4th intercostal space (between 4th and 5th rib, right side |
| V2 | same as V1, but left side |
For our experiment we will use a single-lead system, in which we use the left leg (LL) as reference and display Lead I (LA - RA). On our electrodes, LA and RA are written as L and R and LL appears as P.
EKG Signal
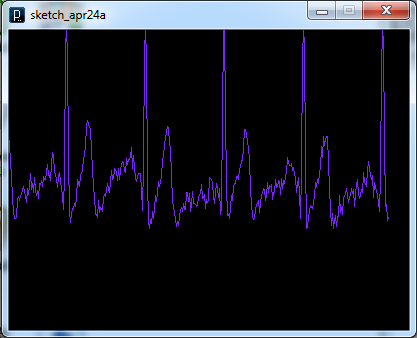
The EKG Signal appears as in the following figure. The main features you will be able to distinguish on our boards are the three segments: The P-Wave, The QRS complex and the T-wave. Of special interest is the QRS-complex because it is easy to detect in software and the time between these features in adjacent cycles gives us the pulse (which we will measure in bpm).
The board
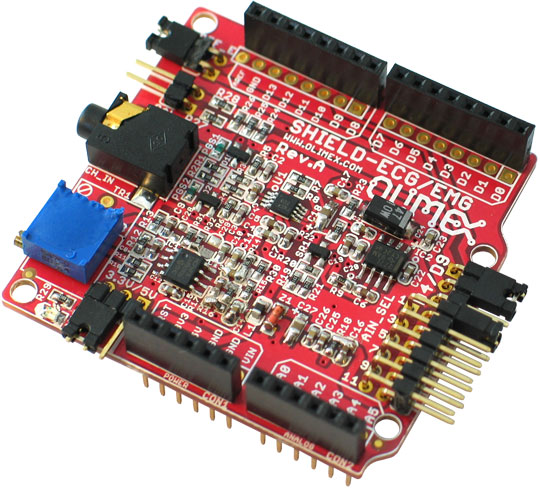
The EKG extension board from Olimex offers very good measurement for an EKG, since it has an amplification chain: A succession of amplification stages (enlarging the signal) and differential inputs (it actually measures the difference between two signals, given a reference - in our case it measures LL - LR, with P as reference). As a user of this board all you need to know is that you can connect the output of the measurement to 1 in 6 possible channels (by default, the measurement is sent to ADC channel 1).
The application
1st exercise - Basic Display of EKG
Our first objective is to display the EKG data as in the image below:
To do this you need to use the “Processing” sketch from day2 and the “Analog Input” sketch from the Arduino and modify the accordingly:
- Make the “Processing” application display a line graph instead of a bar graph (as illustrated above)
- Hint You need to retain one past value
- Modify the “Analog Input” sketch to send from the correct ADC channel
To test this you must connect all three electrodes in their designated positions:
- L on the left arm, interior part of the wrist
- R on the right arm, same position as L
- P on the left leg, interior part of calf muscle
The subject/patient must stay still, it should work while sitting on a chair, as relaxed as possible, but for best results the patient should lie down. The difference between this system and medical-grade equipment is the number of electrodes and their positioning and contact surface with the skin.
2nd exercise - Detecting peaks
Our second objective is to try to detect the QRS-complex on the EKG curve. You will display a heart symbol on the LCD 200 ms after such a peak, then turning it off.
You will have to:
- Connect the LCD extension board on top of the EKG extension
- Detect the QRS pulse (perhaps using thresholds?)
- Display either a ♥ or a ' ' (space) (Why?)
A custom character (such as the ♥ symbol), is defined by a vector of integers:
 byte heart[8] = {
  0b00000,
  0b01010,
  0b11111,
  0b11111,
  0b11111,
  0b01110,
  0b00100,
  0b00000
};
This is then inserted into the LCD's memory during the execution of the setup function:
lcd.createChar(0, heart);
createChar puts a new character into memory from the array of integers (heart in this example) to a certain position (here '0').
To write a ♥, use:
lcd.write((uint8_t)0); // 0 was the index of the heart symbol that we put in createChar
![]() Are the measurements evenly spaced? How much time passes from one measurement to another?
Are the measurements evenly spaced? How much time passes from one measurement to another?
3rd exercise - Spacing measurements evenly
Using delay in the previous exercise means that the time between two measurements is delay_interval + how long it takes to run the code. In Day 1 we explained at the very end a method for not using delay: using the millis() function. Transform your sketch to use this instead of delay.
![]() How much time passes between measurements now? Why is this important?
How much time passes between measurements now? Why is this important?
4th exercise - Calculating and displaying pulse
Now that measurements are evenly spaced we can calculate our pulse using the time between two QRS peaks.

![]() What happens on the LCD if you print a number on two digits and then a number on one digit on a future iteration?
What happens on the LCD if you print a number on two digits and then a number on one digit on a future iteration?
- Text is overwritten so there will be trailing digits remaining on the LCD screen. The following code is meant to first erase the previous number and then write the new value
lcd.setCursor(10,1);
lcd.print("    ");
lcd.setCursor(10,1);
lcd.print(pulse);
5th exercise - Averaging the pulse on-the-go
The following formula is used when we want to average values on-the-go, without retaining all elements in an array (retaining at each step only the average and the number of elements).

Using lcd.setCursor, display on the right side of the LCD the average pulse of the patient.


