Lab 02 - Program Analysis
Overview/Motivation
Operating systems introduce two fundamental abstractions: files and processes. Binary (executable) files can be viewed as a static abstraction of resources, while processes can be viewed as a dynamic representation of resources. The process of transforming the static entity (binary executable files) in a dynamic entity (process) is called loading. The loader, which is a piece of code that is part of the operating system, has to read the binary executable file, allocate resources (e.g. memory), create OS data structures that represent a live process, and, ultimately set the instruction pointer to the very first instruction of the program.
For this, the loader requires information such as the process' memory layout and the address of the first instruction. All this (meta-)information resides in the executable format, that the loader has to understand somehow – hence, each loadable executable binary has a specific format.
History of binary formats
Sun Microsystems' SunOS came up with the concept of dynamic shared libraries and introduced it to UNIX in the late 1980s. UNIX System V Release 4, which Sun co-developed, introduced the ELF object format adaptation from the Sun scheme. Later it was developed and published as part of the ABI (Application binary interface) as an improvement over COFF, the previous object format and by the late 1990s it had become the standard for UNIX and UNIX-like systems including Linux and BSD derivatives. Depending on processor architectures several specifications have emerged with minor changes http://www.skyfree.org/linux/references/ELF_Format.pdf.
Useful references:
list of all ELF specification formats
-
-
Anatomy of an executable file
As discussed above, executable files contain (in addition to the actual executable code) metadata that the loader needs in order to start a given program. Linux commonly uses the ELF format to hold at least the following program metadata:
The entry point (where does the program start?)
Section and segment information (how is the program organized in memory?)
Symbol information for dynamically linked executables (to be discussed in the next lab)
The figure below shows how ELF sections and segments are organized: the section header table contains linking information for (static) sections, while the program header describes the run-time memory layout to the loader using segments. For example here the .text and .rodata sections are both part of the same (read-only) program segment.

Walk-through: inspecting ELF files
Let's suppose we want to find out information about the 64-bit hello program included in the 01-hello directory. A first step would be to look at the header:
$ readelf -h hello
ELF Header:
  Magic:   7f 45 4c 46 02 01 01 00 00 00 00 00 00 00 00 00
  Class:                             ELF64
  Data:                              2's complement, little endian
  Version:                           1 (current)
  OS/ABI:                            UNIX - System V
  ABI Version:                       0
  Type:                              DYN (Shared object file)
  Machine:                           Advanced Micro Devices X86-64
  Version:                           0x1
  Entry point address:               0x1040
  Start of program headers:          64 (bytes into file)
  Start of section headers:          14680 (bytes into file)
  Flags:                             0x0
  Size of this header:               64 (bytes)
  Size of program headers:           56 (bytes)
  Number of program headers:         11
  Size of section headers:           64 (bytes)
  Number of section headers:         29
  Section header string table index: 28
We observe the following:
The program's entry point is at address 0x1040. Note that this assumes that the address will contain code after the program is loaded.
The program headers are at offset 64 in the file.
The section headers are at offset 14680 in the file.
ELF sections
Looking at the program sections:
$ readelf -SW hello

There are 29 section headers, starting at offset 0x3958:

Section Headers:
  [Nr] Name              Type            Address          Off    Size   ES Flg Lk Inf Al
  [ 0]                   NULL            0000000000000000 000000 000000 00      0   0  0
  [ 1] .interp           PROGBITS        00000000000002a8 0002a8 00001c 00   A  0   0  1
...
  [11] .init             PROGBITS        0000000000001000 001000 00001b 00  AX  0   0  4
  [12] .plt              PROGBITS        0000000000001020 001020 000020 10  AX  0   0 16
  [13] .text             PROGBITS        0000000000001040 001040 000185 00  AX  0   0 16
  [14] .fini             PROGBITS        00000000000011c8 0011c8 00000d 00  AX  0   0  4
  [15] .rodata           PROGBITS        0000000000002000 002000 000010 00   A  0   0  4
...
  [21] .got              PROGBITS        0000000000003fd8 002fd8 000028 08  WA  0   0  8
  [22] .got.plt          PROGBITS        0000000000004000 003000 000020 08  WA  0   0  8
  [23] .data             PROGBITS        0000000000004020 003020 000010 00  WA  0   0  8
  [24] .bss              NOBITS          0000000000004030 003030 000008 00  WA  0   0  1
...
We see that .text, .rodata, .data and .bss are all to be loaded into the program, and that .text contains executable code, while .data and .bss contain writable data. The actual permissions are however determined by looking at the segments.
ELF segments
$ readelf -lW hello

Elf file type is DYN (Shared object file)
Entry point 0x1040
There are 11 program headers, starting at offset 64

Program Headers:
  Type           Offset   VirtAddr           PhysAddr           FileSiz  MemSiz   Flg Align
  PHDR           0x000040 0x0000000000000040 0x0000000000000040 0x000268 0x000268 R   0x8
  INTERP         0x0002a8 0x00000000000002a8 0x00000000000002a8 0x00001c 0x00001c R   0x1
      [Requesting program interpreter: /lib64/ld-linux-x86-64.so.2]
  LOAD           0x000000 0x0000000000000000 0x0000000000000000 0x000558 0x000558 R   0x1000
  LOAD           0x001000 0x0000000000001000 0x0000000000001000 0x0001d5 0x0001d5 R E 0x1000
  LOAD           0x002000 0x0000000000002000 0x0000000000002000 0x000120 0x000120 R   0x1000
  LOAD           0x002de8 0x0000000000003de8 0x0000000000003de8 0x000248 0x000250 RW  0x1000
  DYNAMIC        0x002df8 0x0000000000003df8 0x0000000000003df8 0x0001e0 0x0001e0 RW  0x8
  NOTE           0x0002c4 0x00000000000002c4 0x00000000000002c4 0x000044 0x000044 R   0x4
  GNU_EH_FRAME   0x002010 0x0000000000002010 0x0000000000002010 0x000034 0x000034 R   0x4
  GNU_STACK      0x000000 0x0000000000000000 0x0000000000000000 0x000000 0x000000 RW  0x10
  GNU_RELRO      0x002de8 0x0000000000003de8 0x0000000000003de8 0x000218 0x000218 R   0x1

 Section to Segment mapping:
  Segment Sections...
   00
   01     .interp
   02     .interp .note.gnu.build-id .note.ABI-tag .gnu.hash .dynsym .dynstr .gnu.version .gnu
.version_r .rela.dyn .rela.plt
   03     .init .plt .text .fini
   04     .rodata .eh_frame_hdr .eh_frame
   05     .init_array .fini_array .dynamic .got .got.plt .data .bss
   06     .dynamic
   07     .note.gnu.build-id .note.ABI-tag
   08     .eh_frame_hdr
   09
   10     .init_array .fini_array .dynamic .got
Our hello executable contains 11 segments, where section 02 aggregates read-only data and program code, and section 03 containing writable sections, etc.
From the examples above we notice that sections contain offsets within the binary, while segments contain offsets within the live process' memory.
Symbol table
Finally, we can inspect all the symbols in the binary:
$ readelf -s hello | less
Symbol table '.symtab' contains 63 entries:
   Num:    Value          Size Type    Bind   Vis      Ndx Name
...
    57: 0000000000004038     0 NOTYPE  GLOBAL DEFAULT   24 _end
    58: 0000000000001040    47 FUNC    GLOBAL DEFAULT   13 _start
    59: 0000000000004030     0 NOTYPE  GLOBAL DEFAULT   24 __bss_start
    60: 0000000000001139    23 FUNC    GLOBAL DEFAULT   13 main
    61: 0000000000004030     0 OBJECT  GLOBAL HIDDEN    23 __TMC_END__
    62: 0000000000000000     0 NOTYPE  WEAK   DEFAULT  UND _ITM_registerTMCloneTable
    63: 0000000000000000     0 FUNC    WEAK   DEFAULT  UND __cxa_finalize@@GLIBC_2.2
...
The symbol table contains process information such as the symbol's address, as well as the symbol's type (e.g. a function, a data object) and binding information.
Binding/linkage information is used both by the
linker and the
loader, depending on the attribute. Read on
weak symbols and
visibility for more info.
The compiler view
We remember that compilation goes through the following phases:
The source code of a compilation unit (e.g. .c file) written in a high-level language (C, in our case) is preprocessed and compiled into an assembly source file;
The assembly file is then assembled into object code (also called machine code);
Finally, multiple object files are linked into a final executable file or a library.
Each binary file in the compilation process has an executable format attached to it. Particularly in the case of ELF, we have the following types of files:
Relocatable object files
Executable files
Shared objects
Static and dynamic linking
Most types of executable files are obtained from multiple object files, either through static linking or dynamic linking. Static linking involves interpreting each piece of code from each file and then merging all the information inside a single binary that would contain all the machine code necessary for the program. This way of doing things, still in use today, involves loading all of the code and data into memory regardless of use case.

The ELF format also allows executable files to be dynamically linked. Instead of linking all the source files that contain subroutines into the final binaries, separate binaries are organized in libraries that can be loaded per use case, on demand. Essentially, the libraries are loaded only once into memory and when a program instance requires a subroutine from a specific library. In this case, it inquires a special OS component about it and new resources are allocated only for the volatile parts of the library image (.bss and .data).

Walk-through: object files
Let's look through hello.o similarly to how we previously looked through hello. What is different?
ELF header (readelf -h): the file doesn't have an entry point and the ELF type is specified as “Relocatable file”.
ELF sections (readelf -S): they look very similar to the one we inspected previously? What is missing? Any idea why?
The ELF segments are missing, as they are built during linking.
What symbols are there in the symbol table?
Additionally, object files have a relocation table, i.e. a list of all the symbols that are external to the file. Let's look at hello.o:
$ readelf -r hello.o

Relocation section '.rela.text' at offset 0x218 contains 2 entries:
  Offset          Info           Type           Sym. Value    Sym. Name + Addend
000000000007  000500000002 R_X86_64_PC32     0000000000000000 .rodata - 4
00000000000c  000b00000004 R_X86_64_PLT32    0000000000000000 puts - 4
...
We notice that one of the external symbols is puts. Since that is part of the C library, the linker must resolve its location and replace all occurrences with the symbol's address.
This is where the difference between static and dynamic linking shows. During
static linking, the
actual symbol address is filled in; while
dynamic linking uses dynamic relocation tables (the
Global Offset Table and the Procedure Linkage Table) whose values are resolved by the loader. More details on this in the next lab.
Walk-through: binary disassembly
As discussed in previous labs, we can disassemble ELF executable files on almost any Linux system using objdump with the -d or the -D flag:
$ objdump -D -M intel hello
hello:     file format elf64-x86-64

...
Disassembly of section .init:

00000000000004e8 <_init>:
 4e8:   48 83 ec 08             sub    rsp,0x8
 4ec:   48 8b 05 f5 0a 20 00    mov    rax,QWORD PTR [rip+0x200af5]        # 200fe8 <__gmon_start__>
 4f3:   48 85 c0                test   rax,rax
 4f6:   74 02                   je     4fa <_init+0x12>
 4f8:   ff d0                   call   rax
 4fa:   48 83 c4 08             add    rsp,0x8
 4fe:   c3                      ret
What is the difference between -d and -D? What does -M do? In general we encourage you to check out the manpages to find out.
Sometimes however it is possible that the code we are dealing with doesn't have any useful metadata associated with it, e.g. it comes in a raw (flat) binary form, the executable format is not recognized or the ELF header is corrupted. Let's take for example the hello2 binary generated from hello2.S in the 01-hello dorectory:
$ objdump -D hello2
objdump: hello2: File format not recognized
$ file hello2
hello2: data
We can force objdump to attempt disassembling raw files by passing the -b flag. In this case however, objdump does not assume any target architecture, so we must pass it explicitly using -m. For example:
$ objdump -D -b binary -m i386 -M intel hello2
hello2:     file format binary


Disassembly of section .data:

00000000 <.data>:
   0:   66 ba 0e 00             mov    dx,0xe
   4:   00 00                   add    BYTE PTR [eax],al
   6:   66 b9 24 00             mov    cx,0x24
   a:   00 00                   add    BYTE PTR [eax],al
   c:   66 bb 01 00             mov    bx,0x1
  10:   00 00                   add    BYTE PTR [eax],al
  12:   66 b8 04 00             mov    ax,0x4
  16:   00 00                   add    BYTE PTR [eax],al
  18:   cd 80                   int    0x80
  1a:   66 b8 01 00             mov    ax,0x1
  1e:   00 00                   add    BYTE PTR [eax],al
  20:   cd 80                   int    0x80
  22:   00 00                   add    BYTE PTR [eax],al
  24:   48                      dec    eax
  25:   65 6c                   gs ins BYTE PTR es:[edi],dx
  27:   6c                      ins    BYTE PTR es:[edi],dx
  28:   6f                      outs   dx,DWORD PTR ds:[esi]
  29:   2c 20                   sub    al,0x20
  2b:   77 6f                   ja     0x9c
  2d:   72 6c                   jb     0x9b
  2f:   64 21 0a                and    DWORD PTR fs:[edx],ecx
Looking back at the hello2.S source file, we notice that the disassembled code maps almost directly. The last part of the binary does not contain any meaningful code, because here objdump attempts to also disassemble data.
Code is also data! The only remarkable difference is that it is interpretable and executable by the machine, but otherwise the CPU will attempt to execute anything marked “executable” by the operating system. This has interesting security implications, as we will see throughout the course.
To obtain raw data we can just dump the binary using hexdump or xxd:
$ xxd hello2
00000000: 66ba 0e00 0000 66b9 2400 0000 66bb 0100  f.....f.$...f...
00000010: 0000 66b8 0400 0000 cd80 66b8 0100 0000  ..f.......f.....
00000020: cd80 0000 4865 6c6c 6f2c 2077 6f72 6c64  ....Hello, world
00000030: 210a                                     !.
Symbol Table
One of the initial goals of the ELF format was to enable dynamic linking. Given the machine code of a binary, various elements inside it will use absolute addresses that are based on the memory address where the binary expects to be loaded. The entire idea of shared libraries is that these can be loaded and unloaded on demand inside the memory space of whichever process needs them at whichever address is available. As such, a map of how to locate and relocate absolute data points inside the machine code is needed and that's where the symbol table comes in.
readelf -s libtesting.so.1

Symbol table '.dynsym' contains 8 entries:
   Num:    Value  Size Type    Bind   Vis      Ndx Name
     0: 00000000     0 NOTYPE  LOCAL  DEFAULT  UND
     1: 00001339     1 OBJECT  GLOBAL DEFAULT   12 cPub
     2: 000001f8    10 FUNC    GLOBAL DEFAULT    7 fPub
     3: 0000020c   100 FUNC    GLOBAL DEFAULT    7 foo
     4: 00001328    16 OBJECT  GLOBAL DEFAULT   11 a
     5: 00001338     0 NOTYPE  GLOBAL DEFAULT  ABS __bss_start
     6: 0000133c     0 NOTYPE  GLOBAL DEFAULT  ABS _end
     7: 00001338     0 NOTYPE  GLOBAL DEFAULT  ABS _edata

Symbol table '.symtab' contains 27 entries:
   Num:    Value  Size Type    Bind   Vis      Ndx Name
     0: 00000000     0 NOTYPE  LOCAL  DEFAULT  UND
     1: 000000b4     0 SECTION LOCAL  DEFAULT    1
     2: 000000e8     0 SECTION LOCAL  DEFAULT    2
     3: 00000168     0 SECTION LOCAL  DEFAULT    3
     4: 000001a8     0 SECTION LOCAL  DEFAULT    4
     5: 000001d0     0 SECTION LOCAL  DEFAULT    5
     6: 000001d8     0 SECTION LOCAL  DEFAULT    6
     7: 000001f8     0 SECTION LOCAL  DEFAULT    7
     8: 00001274     0 SECTION LOCAL  DEFAULT    8
     9: 00001314     0 SECTION LOCAL  DEFAULT    9
    10: 00001318     0 SECTION LOCAL  DEFAULT   10
    11: 00001328     0 SECTION LOCAL  DEFAULT   11
    12: 00001338     0 SECTION LOCAL  DEFAULT   12
    13: 00000000     0 SECTION LOCAL  DEFAULT   13
    14: 00000000     0 FILE    LOCAL  DEFAULT  ABS libtesting.c
    15: 00000202    10 FUNC    LOCAL  DEFAULT    7 fLocal
    16: 00001338     1 OBJECT  LOCAL  DEFAULT   12 cLocal
    17: 00001318     0 OBJECT  LOCAL  HIDDEN  ABS _GLOBAL_OFFSET_TABLE_
    18: 00000270     0 FUNC    LOCAL  HIDDEN    7 __i686.get_pc_thunk.bx
    19: 00001274     0 OBJECT  LOCAL  HIDDEN  ABS _DYNAMIC
    20: 00001339     1 OBJECT  GLOBAL DEFAULT   12 cPub
    21: 000001f8    10 FUNC    GLOBAL DEFAULT    7 fPub
    22: 0000020c   100 FUNC    GLOBAL DEFAULT    7 foo
    23: 00001328    16 OBJECT  GLOBAL DEFAULT   11 a
    24: 00001338     0 NOTYPE  GLOBAL DEFAULT  ABS __bss_start
    25: 0000133c     0 NOTYPE  GLOBAL DEFAULT  ABS _end
    26: 00001338     0 NOTYPE  GLOBAL DEFAULT  ABS _edata
Some information on the symbols that may belong to external files or may be referenced by external files during dynamic linking are copied in the .dynsym section
Name - symbol name
Type
NoType - not specified
FUNC - the symbol influences a function
SECTION - associated with a section
FILE - a symbol that references a files
Bind
Size - the size of the symbol in bytes or 0 if it is unknown
Ndx
UND - unspecified section reference
COM - unallocated C external variable
ABS - an absolute value for the reference
value - an index into the section table
Value - if the symbol table is part of an executable, the value will contain a memory address where the symbol resides. Otherwise it will contain an offset from the beginning of the section referenced by Ndx or O.
As you can see, the symbol table as it appears in object files compiled with gcc is quite verbose, revealing function names and visibility as well as variable scopes, names and even sizes. In its default form it even shows the name of the sourcefile.
In order to subvert Reverse Engineering attempts you can check out some of the methods of stripping the symbol table of valuable information:
Relocations
Relocations were a concept that was present ever since the invention of static linking. The initial purpose of relocations was to give the static linker a roadmap when combining multiple object files into a binary by stating:
the symbol that needs to be fixed
where you can find the symbol (file/section offset)
an algorithm for making the fixes
The fixes would usually be made in the .data and .text sections and everything was well. Dynamic runtime brought a bit of a complication to modifications that needed to be made in the code segments. The whole idea of shared libraries is that the code can be loaded once into memory from an ELF file then shared among all the processes that use the library. The only way to reliably do this is to make the code section read-only.
In order to compensate for this constraint a special data section called the GOT (global offset table) was created. When the code needs to work with a symbol that belongs to shared object, in the code entry for that symbol uses addresses from the GOT table. First time the symbol is referenced the dynamic linker corrects the entry in GOT and on subsequent calls the correct address will be used.
When implementing calls to subroutines in shared objects, a different table is used called the PLT (procedure linkage table). The initial call is made to a stub sequence in the PLT which bounces off a GOT entry in order to push the subroutine name on the stack and then calls the resolver (mentioned in the INTERP program header).
Relocations and how they get applied are very complex topic and we will only try to cover as far is helps detecting file and symbol types
If you want to read more you can refer to some of these resources:
readelf -r libdynamic.o

Relocation section '.rel.text' at offset 0x5f8 contains 8 entries:
 Offset     Info    Type            Sym.Value  Sym. Name
0000001d  00001402 R_386_PC32        00000000   __i686.get_pc_thunk.bx
00000023  0000150a R_386_GOTPC       00000000   _GLOBAL_OFFSET_TABLE_
00000029  00000409 R_386_GOTOFF      00000000   .bss
0000002f  00000409 R_386_GOTOFF      00000000   .bss
00000035  00000d03 R_386_GOT32       00000004   so_int_global
00000041  00000d03 R_386_GOT32       00000004   so_int_global
00000052  00000e04 R_386_PLT32       00000000   so_fpublic_global
0000005b  00000209 R_386_GOTOFF      00000000   .text

Relocation section '.rel.data.rel.local' at offset 0x638 contains 2 entries:
 Offset     Info    Type            Sym.Value  Sym. Name
00000000  00000401 R_386_32          00000000   .bss
00000004  00000201 R_386_32          00000000   .text

Relocation section '.rel.data.rel' at offset 0x648 contains 2 entries:
 Offset     Info    Type            Sym.Value  Sym. Name
00000000  00000d01 R_386_32          00000004   so_int_global
00000004  00000e01 R_386_32          00000000   so_fpublic_global
Offset - In relocatable files and linked shared objects it contains the offset from the beginning of the section , where the relocation needs to be applied
Info - This field is used to derive the index in the symbol table to the affected symbol as well as the algorithm needed for fixing.
readelf is nice enough to interpret the symbol table for us and gives us the relocation algorithm in the Type field and also the symbol name and value as defined in the symbol table
By looking at the types of relocations we can draw some basic conclusions about the symbol types and also about the files.
Executable files that are statically linked do not contain relocations
Memory layout of a process
To understand the full picture of program execution it is vital to understand the memory layout of processes from ELF executables.
The kernel provides an interface in /proc/<PID>/maps for each process to see how the memory layout looks like.
Let's write a simple Hello World application and investigate.
Note that we have removed Address Space Layout Randomization for these examples. We'll explain this later.
Disable: echo 0 | sudo tee /proc/sys/kernel/randomize_va_space
Enable again: echo 2 | sudo tee /proc/sys/kernel/randomize_va_space
#include <stdio.h>
int main()
{
	printf("Hello world\n");
	malloc(10000);
	while(1){
		;
	}
	return 0;
}
$ gcc -Wall hw.c -o hw
$ ./hw  &
[4] 27593
Hello world
$ cat /proc/27593/maps
55a8b6781000-55a8b6782000 r-xp 00000000 08:07 941779                     /tmp/hw
55a8b6981000-55a8b6982000 r--p 00000000 08:07 941779                     /tmp/hw
55a8b6982000-55a8b6983000 rw-p 00001000 08:07 941779                     /tmp/hw
55a8b7eac000-55a8b7ecd000 rw-p 00000000 00:00 0                          [heap]
7fb2e101f000-7fb2e1206000 r-xp 00000000 08:07 4470159                    /lib/x86_64-linux-gnu/libc-2.27.so
7fb2e1206000-7fb2e1406000 ---p 001e7000 08:07 4470159                    /lib/x86_64-linux-gnu/libc-2.27.so
7fb2e1406000-7fb2e140a000 r--p 001e7000 08:07 4470159                    /lib/x86_64-linux-gnu/libc-2.27.so
7fb2e140a000-7fb2e140c000 rw-p 001eb000 08:07 4470159                    /lib/x86_64-linux-gnu/libc-2.27.so
7fb2e140c000-7fb2e1410000 rw-p 00000000 00:00 0
7fb2e1410000-7fb2e1437000 r-xp 00000000 08:07 4470131                    /lib/x86_64-linux-gnu/ld-2.27.so
7fb2e1615000-7fb2e1617000 rw-p 00000000 00:00 0
7fb2e1637000-7fb2e1638000 r--p 00027000 08:07 4470131                    /lib/x86_64-linux-gnu/ld-2.27.so
7fb2e1638000-7fb2e1639000 rw-p 00028000 08:07 4470131                    /lib/x86_64-linux-gnu/ld-2.27.so
7fb2e1639000-7fb2e163a000 rw-p 00000000 00:00 0
7ffef6ef8000-7ffef6f19000 rw-p 00000000 00:00 0                          [stack]
If we start another process in the background the output for it will be exactly the same as this one. Why is that? The answer, of course, is virtual memory.
The kernel provides this mechanism through which each process has an address space completely isolated from that of other running processes. They can still communicate using inter-process communication mechanisms provided by the kernel but we won't get into that here.
Executable
As we have seen, there are three memory regions associated with the executable:
55a8b6781000-55a8b6782000 r-xp 00000000 08:07 941779                     /tmp/hw
55a8b6981000-55a8b6982000 r--p 00000000 08:07 941779                     /tmp/hw
55a8b6982000-55a8b6983000 rw-p 00001000 08:07 941779                     /tmp/hw
From their permissions we can infer what they correspond to:
55a8b6781000-55a8b6782000 r-xp is the .text section along with the rest of the executable parts
55a8b6981000-55a8b6982000 r–p is the .rodata section
55a8b6982000-55a8b6983000 rw-p consists of the .data, .bss sections and other R/W sections.
It is interesting to note that the executable is almost identically mapped into memory. The only region that is compressed in the binary is the .bss section.
Let's see this in action by dumping the header of the file (note that r2 -d starts the program in debug mode):
$ r2 ./hw
[0x00000580]> px@0
- offset -   0 1  2 3  4 5  6 7  8 9  A B  C D  E F  0123456789ABCDEF
0x00000000  7f45 4c46 0201 0100 0000 0000 0000 0000  .ELF............
0x00000010  0300 3e00 0100 0000 8005 0000 0000 0000  ..>.............
0x00000020  4000 0000 0000 0000 5819 0000 0000 0000  @.......X.......
0x00000030  0000 0000 4000 3800 0900 4000 1d00 1c00  ....@.8...@.....
0x00000040  0600 0000 0400 0000 4000 0000 0000 0000  ........@.......
0x00000050  4000 0000 0000 0000 4000 0000 0000 0000  @.......@.......
0x00000060  f801 0000 0000 0000 f801 0000 0000 0000  ................
0x00000070  0800 0000 0000 0000 0300 0000 0400 0000  ................
0x00000080  3802 0000 0000 0000 3802 0000 0000 0000  8.......8.......
0x00000090  3802 0000 0000 0000 1c00 0000 0000 0000  8...............
0x000000a0  1c00 0000 0000 0000 0100 0000 0000 0000  ................
0x000000b0  0100 0000 0500 0000 0000 0000 0000 0000  ................
0x000000c0  0000 0000 0000 0000 0000 0000 0000 0000  ................
0x000000d0  8808 0000 0000 0000 8808 0000 0000 0000  ................
0x000000e0  0000 2000 0000 0000 0100 0000 0600 0000  .. .............
0x000000f0  b00d 0000 0000 0000 b00d 2000 0000 0000  .......... .....

$ r2 -d ./hw
Process with PID 28998 started...
= attach 28998 28998
bin.baddr 0x563726471000
Using 0x563726471000
asm.bits 64

[0x7fef31d18090]> px@0x563726471000
- offset -       0 1  2 3  4 5  6 7  8 9  A B  C D  E F  0123456789ABCDEF
0x563726471000  7f45 4c46 0201 0100 0000 0000 0000 0000  .ELF............
0x563726471010  0300 3e00 0100 0000 8005 0000 0000 0000  ..>.............
0x563726471020  4000 0000 0000 0000 5819 0000 0000 0000  @.......X.......
0x563726471030  0000 0000 4000 3800 0900 4000 1d00 1c00  ....@.8...@.....
0x563726471040  0600 0000 0400 0000 4000 0000 0000 0000  ........@.......
0x563726471050  4000 0000 0000 0000 4000 0000 0000 0000  @.......@.......
0x563726471060  f801 0000 0000 0000 f801 0000 0000 0000  ................
0x563726471070  0800 0000 0000 0000 0300 0000 0400 0000  ................
0x563726471080  3802 0000 0000 0000 3802 0000 0000 0000  8.......8.......
0x563726471090  3802 0000 0000 0000 1c00 0000 0000 0000  8...............
0x5637264710a0  1c00 0000 0000 0000 0100 0000 0000 0000  ................
0x5637264710b0  0100 0000 0500 0000 0000 0000 0000 0000  ................
0x5637264710c0  0000 0000 0000 0000 0000 0000 0000 0000  ................
0x5637264710d0  8808 0000 0000 0000 8808 0000 0000 0000  ................
0x5637264710e0  0000 2000 0000 0000 0100 0000 0600 0000  .. .............
0x5637264710f0  b00d 0000 0000 0000 b00d 2000 0000 0000  .......... .....
Heap
The heap comes right after the executable at 0x56534a4c5000 and ends at 0x56534a4e6000 which is the current brk point. The brk point is actually a pointer which shows where the heap ends. Increasing the address brk points to means provisioning more memory to the heap of the process while decreasing it means decreasing the available memory given to the process heap (for more information read through the brk man page). The memory allocator will increase the brk when more allocations are made but will not decrease it when memory is freed so as to reuse the memory regions for future allocations.
The allocator in libc actually keeps a list of past allocations and their sizes. When future allocations will require the same size as a previously freed region, the allocator will reuse one from this lookup table. The process is called binning.
Let's see how the brk evolves in our executable using strace:
$ strace -i -e brk ./hw
[ Process PID=1995 runs in 32 bit mode. ]
[f7ff2314] brk(0)                       = 0x804b000
Hello world
[f7fdb430] brk(0)                       = 0x804b000
[f7fdb430] brk(0x806e000)               = 0x806e000
Let's test the fact that the brk does not decrease and that future malloc's can reuse previously freed regions:
#include <stdio.h>
int main()
{
	void * buf[15];
	int i;
	for( i = 0 ; i < 15; i++)
		buf[i] = malloc( i * 100) ;

	for( i = 0 ; i < 15; i++)
		free( buf[i] );

	for( i = 0 ; i < 15; i++)
		buf[i] = malloc( i * 100) ;


	return 0;
}
$ strace -e brk ./hw
brk(NULL)                               = 0x558fd85fe000
brk(NULL)                               = 0x558fd85fe000
brk(0x558fd861f000)                     = 0x558fd861f000
+++ exited with 0 +++

$ ltrace -e malloc ./hw
hw->malloc(0)                                                                   = 0x55d232990260
hw->malloc(100)                                                                 = 0x55d232990280
hw->malloc(200)                                                                 = 0x55d2329902f0
hw->malloc(300)                                                                 = 0x55d2329903c0
hw->malloc(400)                                                                 = 0x55d232990500
hw->malloc(500)                                                                 = 0x55d2329906a0
hw->malloc(600)                                                                 = 0x55d2329908a0
hw->malloc(700)                                                                 = 0x55d232990b00
hw->malloc(800)                                                                 = 0x55d232990dd0
hw->malloc(900)                                                                 = 0x55d232991100
hw->malloc(1000)                                                                = 0x55d232991490
hw->malloc(1100)                                                                = 0x55d232991880
hw->malloc(1200)                                                                = 0x55d232991ce0
hw->malloc(1300)                                                                = 0x55d2329921a0
hw->malloc(1400)                                                                = 0x55d2329926c0
hw->malloc(0)                                                                   = 0x55d232990260

hw->malloc(100)                                                                 = 0x55d232990280
hw->malloc(200)                                                                 = 0x55d2329902f0
hw->malloc(300)                                                                 = 0x55d2329903c0
hw->malloc(400)                                                                 = 0x55d232990500
hw->malloc(500)                                                                 = 0x55d2329906a0
hw->malloc(600)                                                                 = 0x55d2329908a0
hw->malloc(700)                                                                 = 0x55d232990b00
hw->malloc(800)                                                                 = 0x55d232990dd0
hw->malloc(900)                                                                 = 0x55d232991100
hw->malloc(1000)                                                                = 0x55d232991490
hw->malloc(1100)                                                                = 0x55d232991880
hw->malloc(1200)                                                                = 0x55d232991ce0
hw->malloc(1300)                                                                = 0x55d2329921a0
hw->malloc(1400)                                                                = 0x55d2329926c0
+++ exited (status 0) +++
As you can see, only one brk call is made. Furthermore, after the regions are freed they are reused.
This behaviour of the allocator is important in the Use After Free class of vulnerabilities which we will be covering in the next labs
Stack
If you observed from previous traces, the mmap call returns addresses towards NULL (lower addresses). It behaves like this because there is another important memory region called the stack that has a fixed size: usually 8 MB. Since the heap and the mmap region do not have this limit imposed the optimization is to start mmap-ings from a known boundary: the stack end boundary.
Let's put this into perspective. You can view the current stack limit using ulimit -s
$ ulimit -s
8192
$ python
>>> hex(0xffffffff - 8192*1024)
'0xff7fffff'
This address is the stack boundary. It seems odd then that the first mmap in the program above ends at 0xf7ffe000 and not 0xff7fffff. This is probably an optimization.
However, we can set the stack size to unlimited and the mmap allocation direction will reverse:
$ ulimit -s unlimited
$ strace -e mmap,brk ./hw_large
brk(NULL)                               = 0x55de0894a000
mmap(NULL, 135430, PROT_READ, MAP_PRIVATE, 3, 0) = 0x7f9407f49000
mmap(NULL, 8192, PROT_READ|PROT_WRITE, MAP_PRIVATE|MAP_ANONYMOUS, -1, 0) = 0x7f9407f47000
mmap(NULL, 4131552, PROT_READ|PROT_EXEC, MAP_PRIVATE|MAP_DENYWRITE, 3, 0) = 0x7f9407953000
mmap(0x7f9407d3a000, 24576, PROT_READ|PROT_WRITE, MAP_PRIVATE|MAP_FIXED|MAP_DENYWRITE, 3, 0x1e7000) = 0x7f9407d3a000
mmap(0x7f9407d40000, 15072, PROT_READ|PROT_WRITE, MAP_PRIVATE|MAP_FIXED|MAP_ANONYMOUS, -1, 0) = 0x7f9407d40000
brk(NULL)                               = 0x55de0894a000
brk(0x55de0896b000)                     = 0x55de0896b000
Hello world
Small allocation 0x55de0894a670
mmap(NULL, 1000001536, PROT_READ|PROT_WRITE, MAP_PRIVATE|MAP_ANONYMOUS, -1, 0) = 0x7f93cbfa6000
Big allocation 0x7f93cbfa6010

cat /proc/29961/maps
1485618cd000-14859d27a000 rw-p 00000000 00:00 0
14859d27a000-14859d461000 r-xp 00000000 08:07 4470159                    /lib/x86_64-linux-gnu/libc-2.27.so
14859d461000-14859d661000 ---p 001e7000 08:07 4470159                    /lib/x86_64-linux-gnu/libc-2.27.so
14859d661000-14859d665000 r--p 001e7000 08:07 4470159                    /lib/x86_64-linux-gnu/libc-2.27.so
14859d665000-14859d667000 rw-p 001eb000 08:07 4470159                    /lib/x86_64-linux-gnu/libc-2.27.so
14859d667000-14859d66b000 rw-p 00000000 00:00 0
14859d66b000-14859d692000 r-xp 00000000 08:07 4470131                    /lib/x86_64-linux-gnu/ld-2.27.so
14859d86e000-14859d870000 rw-p 00000000 00:00 0
14859d892000-14859d893000 r--p 00027000 08:07 4470131                    /lib/x86_64-linux-gnu/ld-2.27.so
14859d893000-14859d894000 rw-p 00028000 08:07 4470131                    /lib/x86_64-linux-gnu/ld-2.27.so
14859d894000-14859d895000 rw-p 00000000 00:00 0
562eb5652000-562eb5653000 r-xp 00000000 08:07 941862                     /tmp/hw_large
562eb5852000-562eb5853000 r--p 00000000 08:07 941862                     /tmp/hw_large
562eb5853000-562eb5854000 rw-p 00001000 08:07 941862                     /tmp/hw_large
562eb6ce2000-562eb6d03000 rw-p 00000000 00:00 0                          [heap]
7ffc41980000-7ffc419a1000 rw-p 00000000 00:00 0                          [stack]
As you can see, the big allocation is now towards the stack instead of towards the heap.
Returning to the main functionality of the stack, remember from the previous lab that local variables are declared on the stack. This translates into assembly code in the following way:
int main()
{

        char buf[1000];
        int i;
[...]
}
000000000000073a <main>:
 73a:	55                   	push   rbp
 73b:	48 89 e5             	mov    rbp,rsp
 73e:	48 81 ec f0 03 00 00 	sub    rsp,0x3f0
[...]
0x3f0 is equal to 1008 which is precisely 1000 (from buf) + 4 (from i) + 4 (the storage of another int that the compiler used later in the code)
As the program subtracts more from rsp the kernel will provide pages on-demand until the stack boundary or another mmap-ing is hit. The kernel will, in this case, kill the application because of the Segmentation Fault.
Segmentation Fault
Now that we know everything about the memory address space we can say more about the infamous Segmentation Fault that all of us have, at some time, encountered.
It is basically a permission violation. Apart from the mappings that appear in /proc/<PID>/maps with r--, rw-, etc, you can consider that everything else is ---. Thus, a read access at such a location will violate the permission of that region so the whole app will be killed by the signal received (unless it has a signal handler).
Examples:
dereferencing a NULL pointer will try to read from 0x00000000 which is not (usually) mapped ⇒ SIGSEGV (read access on none)
writing after the end of a heap buffer (if the heap buffer is exactly at the end of a mapping) will determine writes into unmapped pages ⇒ SIGSEGV (write access on none)
trying to write to .rodata ⇒ (write access on read only)
overwriting the stack with “AAAAAAAAAAAAAAAAAAA” will also overwrite the return address and make the execution go to 0x41414141 ⇒ SIGSEGV (execute access on none)
overwriting the stack and return address with another address to a shellcode on the stack ⇒ SIGSEGV (execute access on read/write only)
trying to rewrite the binary ( int *v = main; *v = 0x90909090; ) ⇒ SIGSEGV (write access on read/execute only)
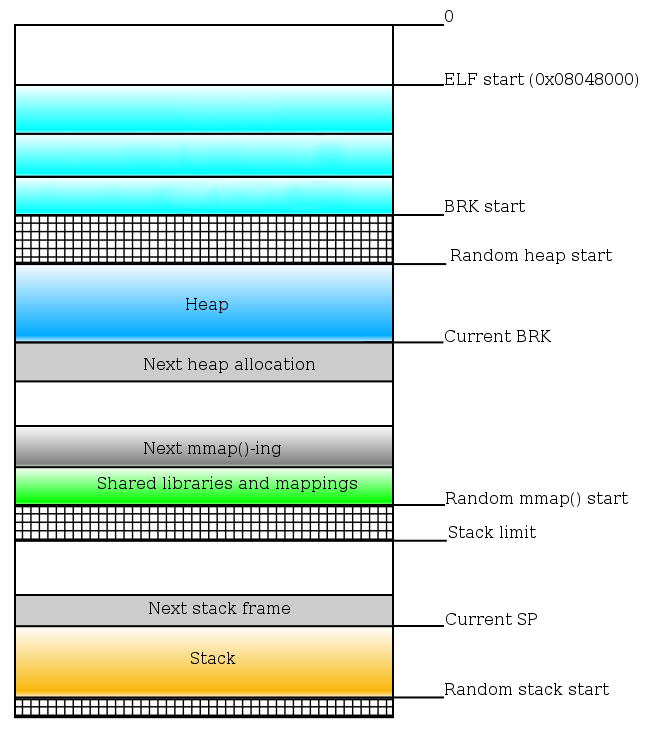
Summary of memory layout without ASLR
We can now add some more labels on the initial schematic to complete the picture:

Address Space Layout Randomization
In practice, you will find that memory mappings are not that static. Actually, most of the offsets might seem to vary at each new run of a binary.
This is a security feature and we will talk about the motives that introduced it in a future lab.
For the moment you should only need to know that the heap, the stack and the mmap areas are randomized by the kernel introducing an initial random offset:

This randomization can be controlled through parameters passed to the kernel. The file /proc/sys/kernel/randomize_va_space provides this interface. You can read from it or write the following values:
0 ⇒ no randomization (that is what we used for the previous listings in this memory layout tutorial)
1 ⇒ stack randomization
2 ⇒ stack, heap and mmap randomization
Tasks
1. Position independent executables
Compile the 01-hello/hello file two times:
- with -no-pie argument
- without -no-pie argument
- What differences do you notice between the compiled binaries? (Check the elf file type, the entry point, the offsets using the tools presented before: file, readelf, objdump)
If you have an older
gcc, it might be the case that it compiles without PIE *by default* (it probably rejects the
-no-pie flag as unknown) and requires a flag to produce a PIE executable.
So use instead:
AND
2. Shellcode
The purpose of this task is to get you acquainted with some tools that can be used to manipulate ELF files.
Go to the 02-shellcode/ directory.
Inspect the source code of shellcode.c
shellcode.c contains a buffer SC, that has raw instructions
What happens when you try to execute the program?
What is the address of the code that this program tries to execute?
readelf -s ./shellcode | grep SC
Why is it happening? in which section is the SC var? with what flags is this segment loaded?
$ readelf -S ./shellcode
[24] .data             PROGBITS         0000000000601020
      0000000000000058  0000000000000000  WA       0     0     32
Try to change the flags of the .data section
objcopy --set-section-flags .data=alloc,code,load ./shellcode
Is it working now? If not why?
NO. remember the two views of a file! the segment is still loaded RW, the loader only knows about segments
 Section to Segment mapping:
  Segment Sections...
   00
   01     .interp
   02     .interp .note.ABI-tag .note.gnu.build-id .gnu.hash .dynsym .dynstr .gnu.version .gnu.version_r .rela.dyn .rela.plt .init .plt .text .fini .rodata .eh_frame_hdr .eh_frame
   03     .ctors .dtors .jcr .dynamic .got .got.plt .data .bss
and segment 03 is:
LOAD           0x0000000000000e28 0x0000000000600e28 0x0000000000600e28
                 0x0000000000000250 0x0000000000000260  RW     200000
Compile run and save the generated shellcode
Compile
What is the type of the file mycode.bin?
$ file ./mycode.bin
./mycode.bin: DOS executable (COM)
How is file working? Is it a false positive?
Try to execute ./mycode.bin!
Who is throwing the error?
The loader, which resides in the operating system
mycode.bin isn't an ELF file, just raw machine code
How to actually run the generated shellcode.
The problem so far is that the shellcode (SC) ends in a segment that does not have the executable bit set. One solution to this is, at runtime, remap the segment (page) with the exec flag – this solution requires writing some code. We can focus on another solution: use tools and .ELF's capability:
Generate an .ELF object file from the raw binary
Check the flags of the .data section! Where are the segments?
Adjust the .data section of this elf as text
Set machine (artifact of objcopy)
Check the flags of the .data section!
How do we actually use the data from this .o file? What symbols are exported?
$ nm ./mycode.bin.o
0000000000000035 D _binary___mycode_bin_end
0000000000000035 A _binary___mycode_bin_size
0000000000000000 D _binary___mycode_bin_start
Link against ./mycode.bin.o
Inspect use-my-code.c! What does it do?
Compile and link!
The stack is still executable, remove this flag!
If you're missing the
execstack binary on the Kali VM (or on any Debian-based distribution), manually download and install it:
# curl -LO http://ftp.de.debian.org/debian/pool/main/p/prelink/execstack_0.0.20131005-1+b10_amd64.deb
# dpkg -i execstack_0.0.20131005-1+b10_amd64.deb
If installation freezes, cancel it then try again.
Why does execstack -c ./*.o throw an error?
Even if the stack is not executable, you should be able to run the shellcode, the data section is executable, please check it!
3. stripped
Someone has given us a stripped binary called stripped. Let's run it and give it a brief view:
$ ./stripped
Hello, there!
I am looping, looping, looping, looping, looping,
$ file ./stripped
./stripped:  ELF 64-bit LSB executable, x86-64, version 1 (SYSV), statically linked, stripped
The executable file is stripped, so we can't rely on any symbol information to look at it. However, it's small enough, so we can try to reverse engineer it by hand. To do that, answer the following questions:
What is the file's entry point?
What instructions get executed started from that entry point?
What operands does the call instruction receive during execution?
Where are ret instructions placed relative to the call operands?
What other control-flow altering instructions are executed besides call and ret?
Normally we use tools such as IDA, Ghidra or Radare2 to reverse engineer binaries. In this case however, we challenge you to use only your brain, a pen and a piece of paper. It's a bit tedious, but the end result should be fun.
You can dump data from within objdump using the -s flag. Use this to figure out what pointers to contents from .data are put into registers.
We get the entry point using readelf -h:
$ readelf -h stripped
...
Entry point address:               0x40105d
...
Dumping the code, we can see that stripped calls a bunch of functions starting with 0x40105d:
$ objdump -D stripped -M intel
...
  40105d:       ba 0e 00 00 00          mov    edx,0xe
  401062:       48 be 00 20 40 00 00    movabs rsi,0x402000
  401069:       00 00 00
  40106c:       e8 19 00 00 00          call   0x40108a
  401071:       e8 d2 ff ff ff          call   0x401048
  401076:       b9 05 00 00 00          mov    ecx,0x5
  40107b:       e8 96 ff ff ff          call   0x401016
  401080:       e8 7c ff ff ff          call   0x401001
  401085:       e8 0d 00 00 00          call   0x401097
  40108a:       b8 01 00 00 00          mov    eax,0x1
  40108f:       bf 01 00 00 00          mov    edi,0x1
  401094:       0f 05                   syscall
  401096:       c3                      ret
...
We stopped at the first encountered ret, assuming that this is where we exit from the function. We'll see this is not quite true!
Let's note the functions that are called starting from the entry point:
f1: 0x40108a, with edx = 0xe and rsi = 0x600158 (we may assume these are passed as arguments)
f2: 0x401048, with no register modifications
f3: 0x401016, with ecx = 0x5 (btw, did you notice how “looping,” is printed 5 times?)
and so on.
Let's look at f1, to see what it does:
  40108a:       b8 01 00 00 00          mov    eax,0x1
  40108f:       bf 01 00 00 00          mov    edi,0x1
  401094:       0f 05                   syscall
  401096:       c3                      ret
It must be remembered that for the 64-bit assembler, the first 6 parameters are passed by register and the rest are placed on the Stack. While for the x86 assembler, all the parameters are placed on the Stack.
We initially assumed that this is part of the main function, but notice that it is a separate function! If we look carefully, we see that it sets eax to 0x1, which is the system call code for write, while edi (the argument for the file descriptor) is set to 0x1 (stdout). Now setting rsi and rdx before this function makes sense, as they are set to the buffer and size arguments of write. So this function is a sort of puts!
This also means that we can look to see whether 0x401097, the final call from the main function, is code that calls the exit syscall. Notice that there are no standard C library functions in the executable, so it must manually call exit.
Let's also look at the first 14 (0xe) bytes starting with 0x402000, the value in rsi:
$ objdump -s stripped
...
Contents of section .data:
 402000 48656c6c 6f2c2074 68657265 210a4920  Hello, there!.I
 402010 616d206c 6f6f7069 6e672c20 0a416c6c  am looping, .All
 402020 20646f6e 65210a                       done!.
We see that this is the string "Hello, there!\n".
4. stripped, re-loaded
Looking more carefully at our stripped binary, we notice that there is one string that it never prints out:
strings -t x stripped
   2000 Hello, there!
   200e I am looping,
   201d All done!
   2028 .shstrtab
   2032 .text
   2038 .data
The string All done! is at offset 0x201d in the binary, that is equivalent to 0x40201d in the loaded program.
$ objdump -D stripped -M intel | grep -A 2 -B 1 0x40201d
  401001:       ba 0a 00 00 00          mov    edx,0xa
  401006:       48 be 1d 20 40 00 00    movabs rsi,0x40201d
  40100d:       00 00 00
  401010:       e8 75 00 00 00          call   0x40108a
This means that the function that does the print (0x400001) is never reached! Why? The reason is that the program exits before doing that.
Find the call to the exit function that occurs at run-time exactly before this print and manually replace it with NOP instructions using the hex editor of your choice. At the end the program should display the following:
./stripped
Hello, there!
I am looping, looping, looping, looping, looping,
All done!
Note that the program should still exit cleanly!
Hint: the NOP instruction has opcode 0x90, so just replace all the bytes of the offending call instruction with that.
5. Memory Dump Analysis
Let's consider the way programs run.
Consider the length of addresses for a given system and note that:
there is a 3GB / 1GB user-mode / kernel-mode split for an i386 system
that split is not the case for a 32bit program running on 64bits, it uses the entire 4GB of required virtual page
In the middle of two programs I added the following lines:
	{
		int i;
		int *a[1];
		for( i = 0 ; i < 20; i++)
			printf("%p\n", a[i]);
	}
The results were the following. respectively:
0x804853b
0x1
0x8048530
(nil)
(nil)
0xf7e0ace5
0x1
0xffffce64
0xffffce6c
0xf7ffcfc0
0x1c
(nil)
0xf7fda4c8
0x2
0xffffce60
0xf7f94e54
(nil)
(nil)
(nil)
0xd545cf8d
and
0xbfffe7d0
0xd696910
0x80484a9
0xb7fffbe8
0x3
0xb7ffefc0
0xb7df6a84
0x1
0xb7fdc780
0xb7fe75fc
0x804c008
0xb7e59195
0x804c008
0xb7fdb000
0xb7fdc000
0x1
0xffffffff
0x3
(nil)
0xf3b9a5b
Answer these questions:
Which of the programs is running on a native 32 bit system? Note: This isn't covered in the lab, you'll have to do a bit of research.
Which values from the stack traces are from the .text region?
Which of the values do not point to valid memory addresses?
Which of the values point to the stack?
Which of the values point to the library/mmap zone?
6. IO Netgarage
Download `level01` from IO Netgarage and solve it using GDB / PEDA. Break on *main, step through the execution and figure out what it does and how to crack it.
Use the command below to copy the level01 executable locally. Use the . (dot) mark at the end of the command to refer to the current directory. Provide level1 as the password.
$ scp level1@io.netgarage.org:/levels/level01 .
7. GDB
Use GDB and PEDA to run the code provided from 07-bash-login/. The executable gets input from the user and evaluates it against a static condition. If it succeeds it then calls a password_accepted function that prints out a success message and spawns a shell. Try to not use a decompiler.
Your task is to use GDB and PEDA to force the executable to call the password_accepted function.
Gather as much info about the executable as possible through the techniques you have learned in previous sessions.
Think of modifying registers for forcing the executable to call the function (there is more than one way of doing this).
Hints:
The 08-change-header directory contains a file named main.bad.
What is the type of main.bad as reported by file command?
Using the skeleton from unscramble.py please fix the elf header! You can put your solution in solution.py or directly in unscramble.py.
The first 6 bytes were modified from the elf header.
What fields correspond to the first bytes?
Can you fix them? Hint: the file is 64 bit executable
After fixing the fields, readelf -h ./main.ok should not complain at all.
Using the file symbol.map and further extending unscramble.py, try to directly call the main and call_me function.
What happens when you try to run the executable that calls the main function directly? Why?
What happens when you try to run the executable that calls the call_me function directly? Why?
What is, in genereral, the very first symbol that is executed inside a process?
Does the loader knows about the existence of this symbol?
Modify the binary entry point such that it will call this symbol!
The output of this exercise should be three binaries: main.ok.main, main.ok.call_me, main.ok.real_main. readelf -h main.ok* should not complain.
Resources


