

This is an old revision of the document!
Lab 09 - Memory, CPU and Network Monitoring (Windows)
Objectives
- Find the root cause if the system runs out of memory with Task Manager, Windows Performance Recorder, Windows Performance Analyzer, Visual Studio, VMMap.
- Monitor the CPU usage with Task Manager, Windows Performance Recorder, Windows Performance Analyzer.
- Check the amount of network traffic generated by processes with Task Manager, Windows Performance Recorder, Microsoft Network Monitoring, Wireshark.
You can download the Windows 10 VM via OneDrive.
If you need to use VirtualBox, you can use this .ovf version to import the VM (just on OneDrive) OneDrive.
There is also the option to download as a torrent ep_win10_vm.7z.torrent.txt. DokuWiki is not configured to accept .torrent files so remove the .txt extension. After that, you know what to do…
Alternatively, you can install the following on your own Windows machine:
- ADK - make sure to check Windows Performance Analyser and Windows Performance Recorder.
- Visual Studio Community Edition - select C++ development.
Contents
Introduction
The Windows operating system contains plenty of built-in tools to analyze its resource usage. The most famous one is probably the Windows Task Manager, as it highlights resource usage of individual processes and gives admins and users the option to kill any misbehaving ones.
The Performance Monitor and Resource Monitor are two additional tools that admins and experienced Windows users may use to analyze performance or any resources related issues on Windows machines.
Tasks
01. [30p] RAM Monitoring
RAM Investigation
![]() Using Windows Performance Recorder, run a program (MemoryLeak.exe) that allocates 1MB of memory every 100 milliseconds for a while and then stops. After the program stops, save the capture, open it in Windows Performance Analyzer and analyze the Virtual Memory Snapshots graph. What conclusion can you draw by looking at the memory usage of the process that is running our program?
Using Windows Performance Recorder, run a program (MemoryLeak.exe) that allocates 1MB of memory every 100 milliseconds for a while and then stops. After the program stops, save the capture, open it in Windows Performance Analyzer and analyze the Virtual Memory Snapshots graph. What conclusion can you draw by looking at the memory usage of the process that is running our program?
![]() Using VMMap, inspect the memory spikes generated by running the same program.
Using VMMap, inspect the memory spikes generated by running the same program.
⠀
RAM Cleaning
Previously we identified that a given program allocated memory and did not free it, which started exhausting our resources. If we still want to run that program, and we do not want to leave it running uninterrupted, we can try “cleaning” our RAM memory during its execution and hope that it helps. Similar with Linux, where we drop caches, in Windows we can use a tool called RAMMap to inspect our memory in detail and free space in RAM.
![]() After starting the program you should see something similar to the image below.
After starting the program you should see something similar to the image below.

Let's now try to use RAMMap to free memory. In the document you can add just two images, a before-after of running all empty routines. Follow the steps below:
- Start RAMMap and position it on the left side of your screen
- Start Task Manager and position it on the right side of your screen
- Start several applications to get your RAM up to at least ~70%
- From the highlighted Empty tab, run every empty routine from top to bottom and inspect the total in Task Manager
![]() Sounds good, but what is a disadvantage of cleaning our RAM too often? Think about performance.
Sounds good, but what is a disadvantage of cleaning our RAM too often? Think about performance.
02. [40p] CPU Monitoring
![]() First of all, monitor the CPU usage of the CPUUsage process, using both Task Manager and Windows Performance Recorder.
First of all, monitor the CPU usage of the CPUUsage process, using both Task Manager and Windows Performance Recorder.
Going further, we want to analyze EvenimenteProcMon program, which has the purpose of integrating your messages with Process Monitor, so these can be viewed as the process unfolds. It is necessary to understand any code, not perfectly, but at least to get the big picture of what is going on.
A ProcessMonitor class with 5 functions was created:
- OpenProcMon opens up a handle for the Process Monitor's message interface.
- CloseProcMon closes this handle.
- ProcMonLog writes the message that is passed as a parameter to the Process Monitor interface.
- MyProcMon is the class constructor. It is called when a MyProcMon object is declared.
- ~ MyProcMon is the class destructor. It is called to destroy the MyProcMon object.
The code below highlights that it was declared globally:
MyProcMon __procMon;
This means that at the start of the process, before executing the main function, when the global variables are initialized, our class instance will be constructed along with the implicit handle for the Process Monitor message interface. The handle is closed when the object is destroyed, after the program's execution ends.
Another class was declared, ProcMonLogFunc, with the purpose of highlighting when entering and leaving a function. This led to defining the following macro, which declares a ProcMonLogFunc object and passes it the name of the current function as a parameter.
#define DBGTRACE_FN_ () ProcMonLogFunc __my_log __ (__ FUNCTIONW__)
![]() Start Process Monitor and change the filter to ProcessName contains EvenimenteProcMon. Select the profiling button as shown below:
Start Process Monitor and change the filter to ProcessName contains EvenimenteProcMon. Select the profiling button as shown below:

After running the program, the Process Monitor tool will generate a capture containing multiple details. We should notice messages such as Output: =⇒ Func1 and Output: ⇐= Func1, with the associated timestamps for these events in the Time of Day column. The difference between these times indicates how long the execution took for Func1, expressed in hundreds of nanoseconds.
As it is inefficient to calculate by hand the times for each function, we can save the output in a .csv format, by going to File → Save and choosing the “Comma-Separated Values” option. The generated file will look like this:
"4:42:07.1846936 PM","EvenimenteProcMon.exe","6352","Debug Output Profiling","","","Output: ==>main"
"4:42:07.1848812 PM","EvenimenteProcMon.exe","6352","Debug Output Profiling","","","Output: Acesta e logul meu 1"
"4:42:07.1848883 PM","EvenimenteProcMon.exe","6352","Debug Output Profiling","","","Output: ==>Func1"
"4:42:07.1848955 PM","EvenimenteProcMon.exe","6352","Debug Output Profiling","","","Output: <==Func1"
"4:42:07.1848990 PM","EvenimenteProcMon.exe","6352","Debug Output Profiling","","","Output: ==>Func2"
"4:42:07.1849038 PM","EvenimenteProcMon.exe","6352","Debug Output Profiling","","","Output: <==Func2"
"4:42:07.1849069 PM","EvenimenteProcMon.exe","6352","Debug Output Profiling","","","Output: ==>Func3"
"4:42:07.1849105 PM","EvenimenteProcMon.exe","6352","Debug Output Profiling","","","Output: <==Func3"
"4:42:07.1849148 PM","EvenimenteProcMon.exe","6352","Debug Output Profiling","","","Output: Acesta e logul meu 2"
"4:42:07.1849184 PM","EvenimenteProcMon.exe","6352","Debug Output Profiling","","","Output: <==main"
![]() Create a simple parser in Python to find out easier the total time spent in every function. If you only want to take into account the CPU usage, you need to have logging messages before and after every I/O operation, in order to not count in their time.
Create a simple parser in Python to find out easier the total time spent in every function. If you only want to take into account the CPU usage, you need to have logging messages before and after every I/O operation, in order to not count in their time.
03. [30p] Network Monitoring
We want to check the network traffic generated by the Winhttp.exe file (a program that downloads putty.exe; it is located in the Debug folder, after successfully running the code). By looking at its content, it can be noticed that it makes a request to www.sociouman-usamvb.ro.
![]() Monitor the network traffic generated by Winhttp.exe using Task Manager, Windows Performance Recorder and Microsoft Network Monitor.
Monitor the network traffic generated by Winhttp.exe using Task Manager, Windows Performance Recorder and Microsoft Network Monitor.
![]() Using Wireshark, capture all the frames generated after running this program. Is it possible to extract the conversation data from the packet exchange? Justify your answer.
Using Wireshark, capture all the frames generated after running this program. Is it possible to extract the conversation data from the packet exchange? Justify your answer.
- Click the Start button and run Winhttp.exe. After Winhttp.exe stops, click the Stop button in Wireshark.
- Use the ping command to get the IP address of the previously mentioned URL.
- Switch back to Wireshark and add a filter for ip.addr == <ip_address> (make sure to use the IP address identified using the ping command).
- Right click on the GET /documents request and choose Follow → TCP Stream.
- In the bottom part of the Wireshark window, at the ”Show and save data as” option, choose “Raw”. Save the capture using the “Save as” button.
- Use Notepad++ to open the .PDF file and remove the headers (GET request and HTTP response).
- Save it, close Notepad++ and double-click on the newly saved .PDF file.
04. [10p] Feedback
![]() Please take a minute to fill in the feedback form for this lab.
Please take a minute to fill in the feedback form for this lab.
![]()
01. [30p] RAM Monitoring
The memory usage by processes is dynamic, thus it is possible to have memory allocation spikes. Task Manager shows the amount of memory allocated to a process. To see this information, check the Peak Working Set value in the Details tab. It can be noticed that sometimes Peak Working Set can be significantly larger than Working Set.

[15p] Task A - Identify the problem
- What can you do if the system runs out of memory, but you do not know what causes this?
Imagine a situation when a system encounters issues if some conditions are met, and these conditions can be reproduced. To find out the source of this problem, start Windows Performance Recorder configured as shown below.

Run in parallel a program that allocates 1MB of memory every 100 milliseconds for a while and then stops. After the program stops running, save the capture and open it in Windows Performance Analyzer. You should get the following.

Click Add all Memory graphs to Analysis View and scroll down to the Virtual Memory Snapshot graph which shows the memory usage for all processes.

After installing, it requires including the vld.h file. When writing the code, the following functions need to be overwritten: malloc, free, new, and delete. This allows each memory allocation and deallocation to be tracked. All the detected leakages (having an allocation that is not followed by a deallocation) will be saved in a log file that can be viewed after the program stops running. In the bottom part of the screenshot shown below, it can be noticed where the allocation took place and that it is not followed by a deallocation.

However, it might be the case that this is not a memory leak, and somewhere at the end of the program the memory gets unallocated. If this is the case, how can you determine which part of the program is responsible for generating the spike? This requires using another tool from SysInternals, VMMap. With this tool you can view a process's memory allocations and usage. Use it to run the program that allocates 1 MB of memory every 100 milliseconds.

Prior to starting the tool, go to Options, Configure Symbols and set the paths to the program's, to the Microsoft Symbol Server, and to the program's source files. Start the tool, select Launch and trace a new process, select the process, select the directory where it will run, and let it run. You will see something similar to the screenshot below. To view the latest memory allocations, you need to double-click Heap in the upper-part of the screenshot, and hit F5 (refresh) from time to time. In the bottom part of the screenshot, you can view the memory allocations. If you click one and press Heap Allocations you can see the stack where the allocation occurred. By pressing the “Source” button, you can view the actual code for the allocation.

[15p] Task B - Conclusions
![]()
![]() NON-DEMO TASK
NON-DEMO TASK
- Provide screenshots with your output and add your explanation.
02. [30p] CPU Monitoring
Task Manager
Monitoring the CPU usage presents similar issues to the ones encountered when monitoring the memory usage. Task Manager can help find out the current CPU usage for a process.

Windows Performance Recorder
Considering the same scenario as the one presented in the previous section: what if the CPU usage briefly spikes up and then goes back to normal, how can you catch this? Using Task Manager would mean having someone continuously watching what is happening to catch the moment when the spike occurs. Use Windows Performance Recorder, with the same settings as in the screenshot below.

Windows Performance Analyzer
After clicking start, run CPUUsage.exe (part of the resources provided at the end of the tutorial), which generates CPU usage. Save and open the catch.

Right-click on to the Computation area and click “Add All Calculation graphs to Analysis View”.

The graph shows the impact of CPUUsage.exe, which inflicts a 12% CPU usage. Part of the problem is solved, it was determined who is generating the CPU usage. Now, to further debug the situation, as in the previous case of the memory, if this process was not written by you, check if it is useful, and if not, make sure to stop it. If it is useful, but it's not yours, you can try to find an update to fix the problem, or report the problem to the producer. If the program is written by you (this course - Performance Evaluation - targets the processes written by us), then it is important to determine what causes this problem. Unfortunately, unlike in the case of monitoring the memory usage, there is no tool that shows the stack with the problem, so you need to create one. Open EvenimenteProcMon, which has the purpose of integrating your messages with ProcessMonitor so they can be viewed as the process unfolds. It is necessary to understand any code, not perfectly, but at least to get the big picture of what is going on.
A ProcessMonitor class with 5 functions was created:
- OpenProcMon opens up a handle for the ProcessMonitor's message interface.
- CloseProcMon closes this handle.
- ProcMonLog writes the message that is passed as a parameter to the ProcessMonitor interface.
- MyProcMon is the class constructor. It is called when a MyProcMon object is declared.
- ~ MyProcMon is the class destructor. It is called to destroy the MyProcMon object.
The code below highlights that it was declared globally:
MyProcMon __procMon;
This means that at the start of the process, before executing the main function, when the global variables are initialized, our class instance will be constructed along with the implicit handle for the ProcessMonitor message interface. The handle is closed when the object is destroyed, after the program's execution ends.
Another class was declared, ProcMonLogFunc, with the purpose of highlighting when entering and leaving a function. This led to defining the following macro, which declares a ProcMonLogFunc object and passes it the name of the current function as a parameter.
#define DBGTRACE_FN_ () ProcMonLogFunc __my_log __ (__ FUNCTIONW__)
| Start ProcessMonitor and change the filter to ProcessName contains EvenimenteProcMon. Select the profiling button as shown below. | |
|
| Running the program, generates a Process Monitor capture like this one. |  |
|
Notice messages such as Output: =⇒ Func1 and Output: ⇐= Func1, with the associated times for these events in the left-hand side of the screenshot, in the Time of Day column. The difference between the times (4:42:07.1848883 and 4:42:07.1848955) is 72, and since the times after the comma are expressed in hundreds of nanoseconds, this means that func1 took 7.2 microseconds.
As it is inefficient to calculate by hand the times for each function, save the output in csv format (File → Save and choose the “Comma-Separated Values” option). The generated file will look like this:
"4:42:07.1846936 PM","EvenimenteProcMon.exe","6352","Debug Output Profiling","","","Output: ==>main"
"4:42:07.1848812 PM","EvenimenteProcMon.exe","6352","Debug Output Profiling","","","Output: Acesta e logul meu 1"
"4:42:07.1848883 PM","EvenimenteProcMon.exe","6352","Debug Output Profiling","","","Output: ==>Func1"
"4:42:07.1848955 PM","EvenimenteProcMon.exe","6352","Debug Output Profiling","","","Output: <==Func1"
"4:42:07.1848990 PM","EvenimenteProcMon.exe","6352","Debug Output Profiling","","","Output: ==>Func2"
"4:42:07.1849038 PM","EvenimenteProcMon.exe","6352","Debug Output Profiling","","","Output: <==Func2"
"4:42:07.1849069 PM","EvenimenteProcMon.exe","6352","Debug Output Profiling","","","Output: ==>Func3"
"4:42:07.1849105 PM","EvenimenteProcMon.exe","6352","Debug Output Profiling","","","Output: <==Func3"
"4:42:07.1849148 PM","EvenimenteProcMon.exe","6352","Debug Output Profiling","","","Output: Acesta e logul meu 2"
"4:42:07.1849184 PM","EvenimenteProcMon.exe","6352","Debug Output Profiling","","","Output: <==main"
Making a parser in Python would make it easy to notice in which of the functions was spent the most time. If you only want to take into account the CPU usage, you need to have logging messages before and after every I/O operation, in order to not count in their time.
![]()
![]() NON-DEMO TASK
NON-DEMO TASK
Integrate CPUUsage with ProcessMonitor and find out the total time spent in every function.
03. [40p] Network Monitoring
Task A [20p] - Go through tutorial
Task Manager
The amount of network traffic generated by a process can be seen using Task Mananger.

Windows Performance Recorder
The resources for this tutorial include Winhttp.exe, a program that downloads putty.exe. The above screenshot displays its network activity. However, if the process generating the network activity is unknown, you can use Windows Performance Recorder with the following settings. Save and open the capture to view it. The statistics offered by Windows Performance Analyzer are for the total use of the network, rather than per process statistics.

Microsoft Network Monitoring
For this reason, we are calling upon another tool developed by Microsoft. Install it, start it using “Run as administrator”, and select the network interface through which the traffic is expected to pass (cable, wifi, …). You should get a capture such as this one:

Wireshark
As in the case of the CPU, inspecting the events taking place on the network involves some amount of work for the analyst. However, this being a simple case, you can just expand the view on the traffic generated by Winhttp.exe, and notice the request for putty.exe. If it is not clear why some requests are there or why they last so long, you can integrate the application that you wish to investigate with ProcessMonitor. This way you can insert logging elements to find out what request are made and how long they take. The part with timing the requests and traffic can be determined straight from Network Monitor by considering the times of the packets. For displaying all traffic on a http connection (it can also be https as long as you control the server, but this in not in the scope of this tutorial), you can use another tool, Wireshark. Install Wireshark (64bit!!!) accepting the default settings. Start it and select the interface that you want to listen to.

Click the Start button and run Winhttp.exe. After Winhttp.exe stops, click the Stop button in Wireshark.

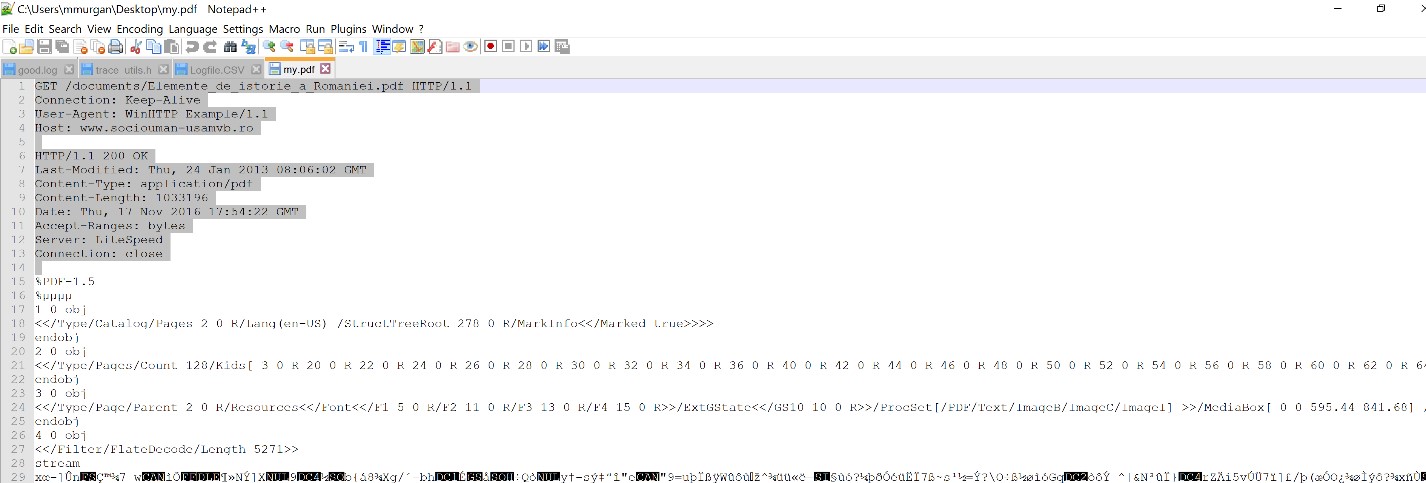
This way you have obtained a traffic capture while winhttp.exe was running. Viewing the code for winhttp.exe, it can be noticed that it makes a request to www.sociouman-usamvb.ro. Use the ping command to get the IP address for this url.

Switching back to Wireshark, add a filter for ip.addr = 86.106.30.115 (make sure to use the IP address identified using ping command). Right click Get documents and choose Follow TCP Stream.

In the bottom part of the Wireshark window, at the ”Show and save data as” option choose “Raw”. Save the capture (using the “Save as” button) as ”my.pdf”.

Use Notepad++ to open the my.pdf file and remove the headers as shown in the screenshot below.

Save it, close Notepad++ and double-click on the newly saved file (my.pdf).

Task B [20p] - Conclusions
![]()
![]() NON-DEMO TASK
NON-DEMO TASK
- Follow the steps above and provide screenshots of the pdf file.
04. [10p] Feedback
01. [30p] RAM Monitoring
RAM Investigation
![]() Using Windows Performance Recorder, run a program (MemoryLeak.exe) that allocates 1MB of memory every 100 milliseconds for a while and then stops. After the program stops, save the capture, open it in Windows Performance Analyzer and analyze the Virtual Memory Snapshots graph. What conclusion can you draw by looking at the memory usage of the process that is running our program?
Using Windows Performance Recorder, run a program (MemoryLeak.exe) that allocates 1MB of memory every 100 milliseconds for a while and then stops. After the program stops, save the capture, open it in Windows Performance Analyzer and analyze the Virtual Memory Snapshots graph. What conclusion can you draw by looking at the memory usage of the process that is running our program?
![]() Using VMMap, inspect the memory spikes generated by running the same program.
Using VMMap, inspect the memory spikes generated by running the same program.
⠀
RAM Cleaning
Previously we identified that a given program allocated memory and did not free it, which started exhausting our resources. If we still want to run that program, and we do not want to leave it running uninterrupted, we can try “cleaning” our RAM memory during its execution and hope that it helps. Similar with Linux, where we drop caches, in Windows we can use a tool called RAMMap to inspect our memory in detail and free space in RAM.
![]() After starting the program you should see something similar to the image below.
After starting the program you should see something similar to the image below.
Let's now try to use RAMMap to free memory. In the document you can add just two images, a before-after of running all empty routines. Follow the steps below:
- Start RAMMap and position it on the left side of your screen
- Start Task Manager and position it on the right side of your screen
- Start several applications to get your RAM up to at least ~70%
- From the highlighted Empty tab, run every empty routine from top to bottom and inspect the total in Task Manager
![]() Sounds good, but what is a disadvantage of cleaning our RAM too often? Think about performance.
Sounds good, but what is a disadvantage of cleaning our RAM too often? Think about performance.
02. [40p] CPU Monitoring
![]() First of all, monitor the CPU usage of the CPUUsage process, using both Task Manager and Windows Performance Recorder.
First of all, monitor the CPU usage of the CPUUsage process, using both Task Manager and Windows Performance Recorder.
Going further, we want to analyze EvenimenteProcMon program, which has the purpose of integrating your messages with Process Monitor, so these can be viewed as the process unfolds. It is necessary to understand any code, not perfectly, but at least to get the big picture of what is going on.
A ProcessMonitor class with 5 functions was created:
- OpenProcMon opens up a handle for the Process Monitor's message interface.
- CloseProcMon closes this handle.
- ProcMonLog writes the message that is passed as a parameter to the Process Monitor interface.
- MyProcMon is the class constructor. It is called when a MyProcMon object is declared.
- ~ MyProcMon is the class destructor. It is called to destroy the MyProcMon object.
The code below highlights that it was declared globally:
MyProcMon __procMon;
This means that at the start of the process, before executing the main function, when the global variables are initialized, our class instance will be constructed along with the implicit handle for the Process Monitor message interface. The handle is closed when the object is destroyed, after the program's execution ends.
Another class was declared, ProcMonLogFunc, with the purpose of highlighting when entering and leaving a function. This led to defining the following macro, which declares a ProcMonLogFunc object and passes it the name of the current function as a parameter.
#define DBGTRACE_FN_ () ProcMonLogFunc __my_log __ (__ FUNCTIONW__)
![]() Start Process Monitor and change the filter to ProcessName contains EvenimenteProcMon. Select the profiling button as shown below:
Start Process Monitor and change the filter to ProcessName contains EvenimenteProcMon. Select the profiling button as shown below:
After running the program, the Process Monitor tool will generate a capture containing multiple details. We should notice messages such as Output: =⇒ Func1 and Output: ⇐= Func1, with the associated timestamps for these events in the Time of Day column. The difference between these times indicates how long the execution took for Func1, expressed in hundreds of nanoseconds.
As it is inefficient to calculate by hand the times for each function, we can save the output in a .csv format, by going to File → Save and choosing the “Comma-Separated Values” option. The generated file will look like this:
"4:42:07.1846936 PM","EvenimenteProcMon.exe","6352","Debug Output Profiling","","","Output: ==>main"
"4:42:07.1848812 PM","EvenimenteProcMon.exe","6352","Debug Output Profiling","","","Output: Acesta e logul meu 1"
"4:42:07.1848883 PM","EvenimenteProcMon.exe","6352","Debug Output Profiling","","","Output: ==>Func1"
"4:42:07.1848955 PM","EvenimenteProcMon.exe","6352","Debug Output Profiling","","","Output: <==Func1"
"4:42:07.1848990 PM","EvenimenteProcMon.exe","6352","Debug Output Profiling","","","Output: ==>Func2"
"4:42:07.1849038 PM","EvenimenteProcMon.exe","6352","Debug Output Profiling","","","Output: <==Func2"
"4:42:07.1849069 PM","EvenimenteProcMon.exe","6352","Debug Output Profiling","","","Output: ==>Func3"
"4:42:07.1849105 PM","EvenimenteProcMon.exe","6352","Debug Output Profiling","","","Output: <==Func3"
"4:42:07.1849148 PM","EvenimenteProcMon.exe","6352","Debug Output Profiling","","","Output: Acesta e logul meu 2"
"4:42:07.1849184 PM","EvenimenteProcMon.exe","6352","Debug Output Profiling","","","Output: <==main"
![]() Create a simple parser in Python to find out easier the total time spent in every function. If you only want to take into account the CPU usage, you need to have logging messages before and after every I/O operation, in order to not count in their time.
Create a simple parser in Python to find out easier the total time spent in every function. If you only want to take into account the CPU usage, you need to have logging messages before and after every I/O operation, in order to not count in their time.
03. [30p] Network Monitoring
We want to check the network traffic generated by the Winhttp.exe file (a program that downloads putty.exe; it is located in the Debug folder, after successfully running the code). By looking at its content, it can be noticed that it makes a request to www.sociouman-usamvb.ro.
![]() Monitor the network traffic generated by Winhttp.exe using Task Manager, Windows Performance Recorder and Microsoft Network Monitor.
Monitor the network traffic generated by Winhttp.exe using Task Manager, Windows Performance Recorder and Microsoft Network Monitor.
![]() Using Wireshark, capture all the frames generated after running this program. Is it possible to extract the conversation data from the packet exchange? Justify your answer.
Using Wireshark, capture all the frames generated after running this program. Is it possible to extract the conversation data from the packet exchange? Justify your answer.
- Click the Start button and run Winhttp.exe. After Winhttp.exe stops, click the Stop button in Wireshark.
- Use the ping command to get the IP address of the previously mentioned URL.
- Switch back to Wireshark and add a filter for ip.addr == <ip_address> (make sure to use the IP address identified using the ping command).
- Right click on the GET /documents request and choose Follow → TCP Stream.
- In the bottom part of the Wireshark window, at the ”Show and save data as” option, choose “Raw”. Save the capture using the “Save as” button.
- Use Notepad++ to open the .PDF file and remove the headers (GET request and HTTP response).
- Save it, close Notepad++ and double-click on the newly saved .PDF file.
04. [10p] Feedback
![]() Please take a minute to fill in the feedback form for this lab.
Please take a minute to fill in the feedback form for this lab.
![]()
