This is an old revision of the document!
Lab 10 - Machine Learning
Objectives
- Understand basic concepts of machine learning
- Remember examples of real-world problems that can be solved with machine learning
- Learn the most common performance evaluation metrics for machine learning models
- Analyse the behaviour of typical machine learning algorithms using the most popular techniques
- Be able to compare multiple machine learning models
Exercises
The exercises will be solved in Python, using various popular libraries that are usually integrated in machine learning projects:
- Scikit-Learn: fast model development, performance metrics, pipelines, dataset splitting
- Pandas: data frames, csv parser, data analysis
- NumPy: scientific computation
- Matplotlib: data plotting
All tasks are tutorial based and every exercise will be associated with at least one “TODO” within the code. Those tasks can be found in the exercises package, but our recommendation is to follow the entire skeleton code for a better understanding of the concepts presented in this laboratory class. Each functionality is properly documented and for some exercises, there are also hints placed in the code.
⚠️ [10p] Task 5.B
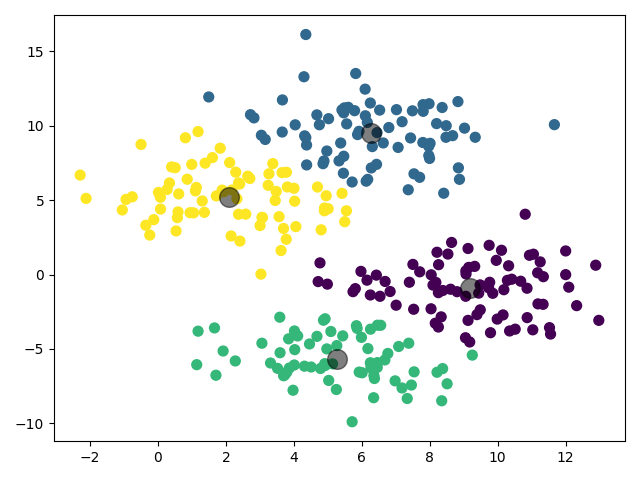
Fetch the centres of the clusters (the model should already have them ready for you ![]() ) and plot them together with a colourful 2D representation of the data groups. Your plot should look similar to the one below:
) and plot them together with a colourful 2D representation of the data groups. Your plot should look similar to the one below:
You can also play around with the standard deviation of the generated blobs and observe the different outcomes of the clustering algorithm:
CLUSTERS_STD = 2
You should be able to discuss these observations with the assistant.
⚠️⚠️ NON-DEMO TASK
Look at the hint above and solve the tasks marked with TODO - TASK B. Make at least 3 changes to the standard deviation. That means that 3 plots should be generated. Save each plot in a separate file.
⚠️ [10p] Exercise 6
⚠️⚠️ NON-DEMO TASK
Please take a minute to fill in the feedback form for this lab.
References
⠀


