This is an old revision of the document!
03. [40p] Network Monitoring
Microsoft Network Monitoring
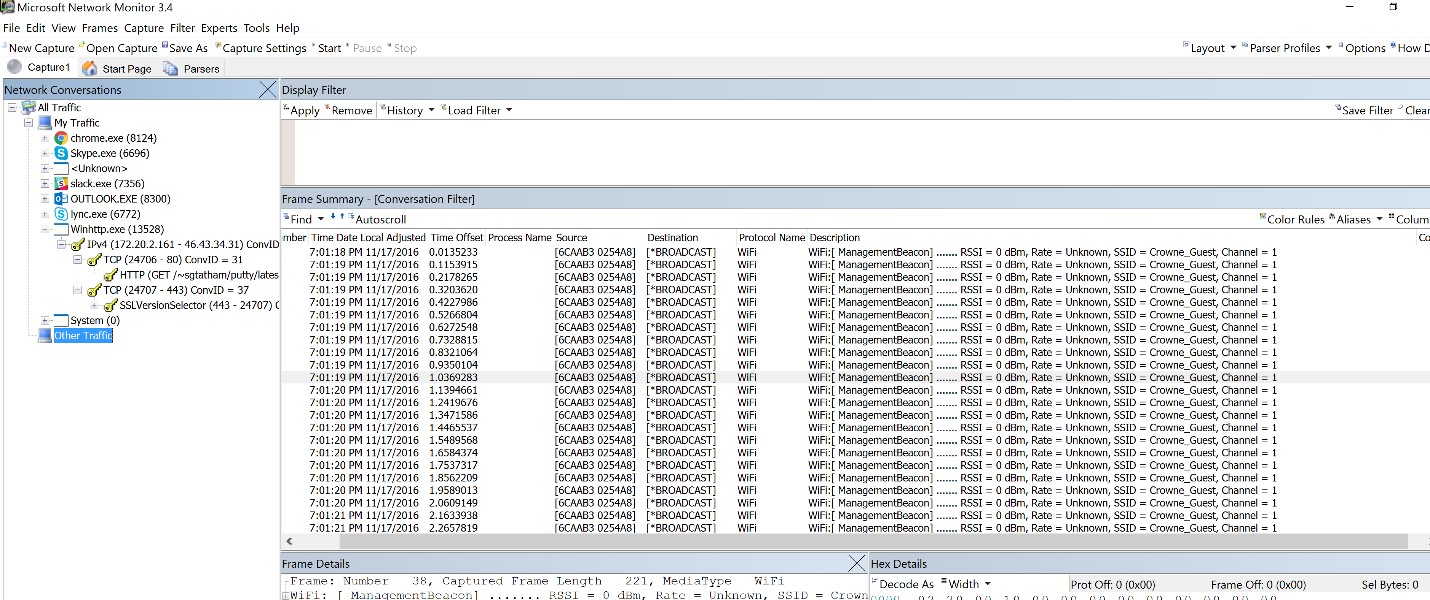
For this reason, we are calling upon another tool developed by Microsoft. Install it, start it using “Run as administrator”, and select the network interface through which the traffic is expected to pass (cable, wifi, …). You should get a capture such as this one:
Wireshark
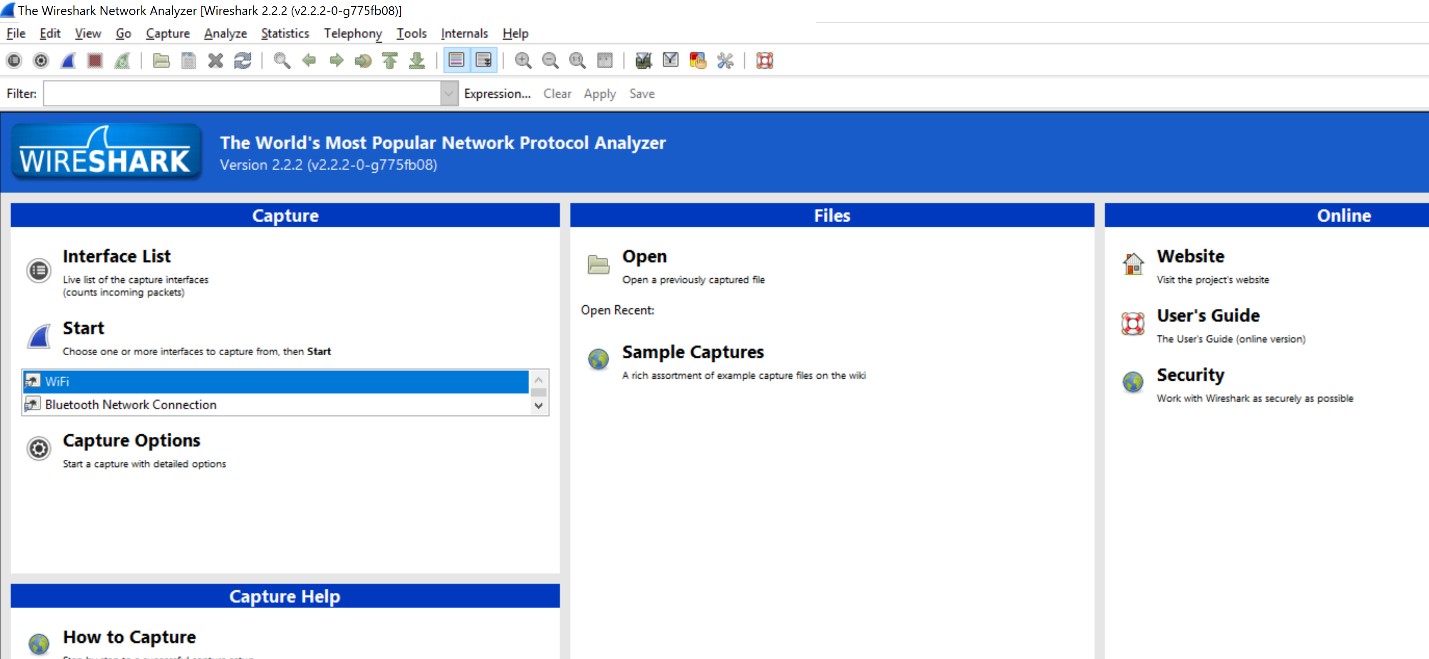
As in the case of the CPU, inspecting the events taking place on the network involves some amount of work for the analyst. However, this being a simple case, you can just expand the view on the traffic generated by Winhttp.exe, and notice the request for putty.exe. If it is not clear why some requests are there or why they last so long, you can integrate the application that you wish to investigate with ProcessMonitor. This way you can insert logging elements to find out what request are made and how long they take. The part with timing the requests and traffic can be determined straight from Network Monitor by considering the times of the packets. For displaying all traffic on a http connection (it can also be https as long as you control the server, but this in not in the scope of this tutorial), you can use another tool, Wireshark. Install Wireshark (64bit!!!) accepting the default settings. Start it and select the interface that you want to listen to.
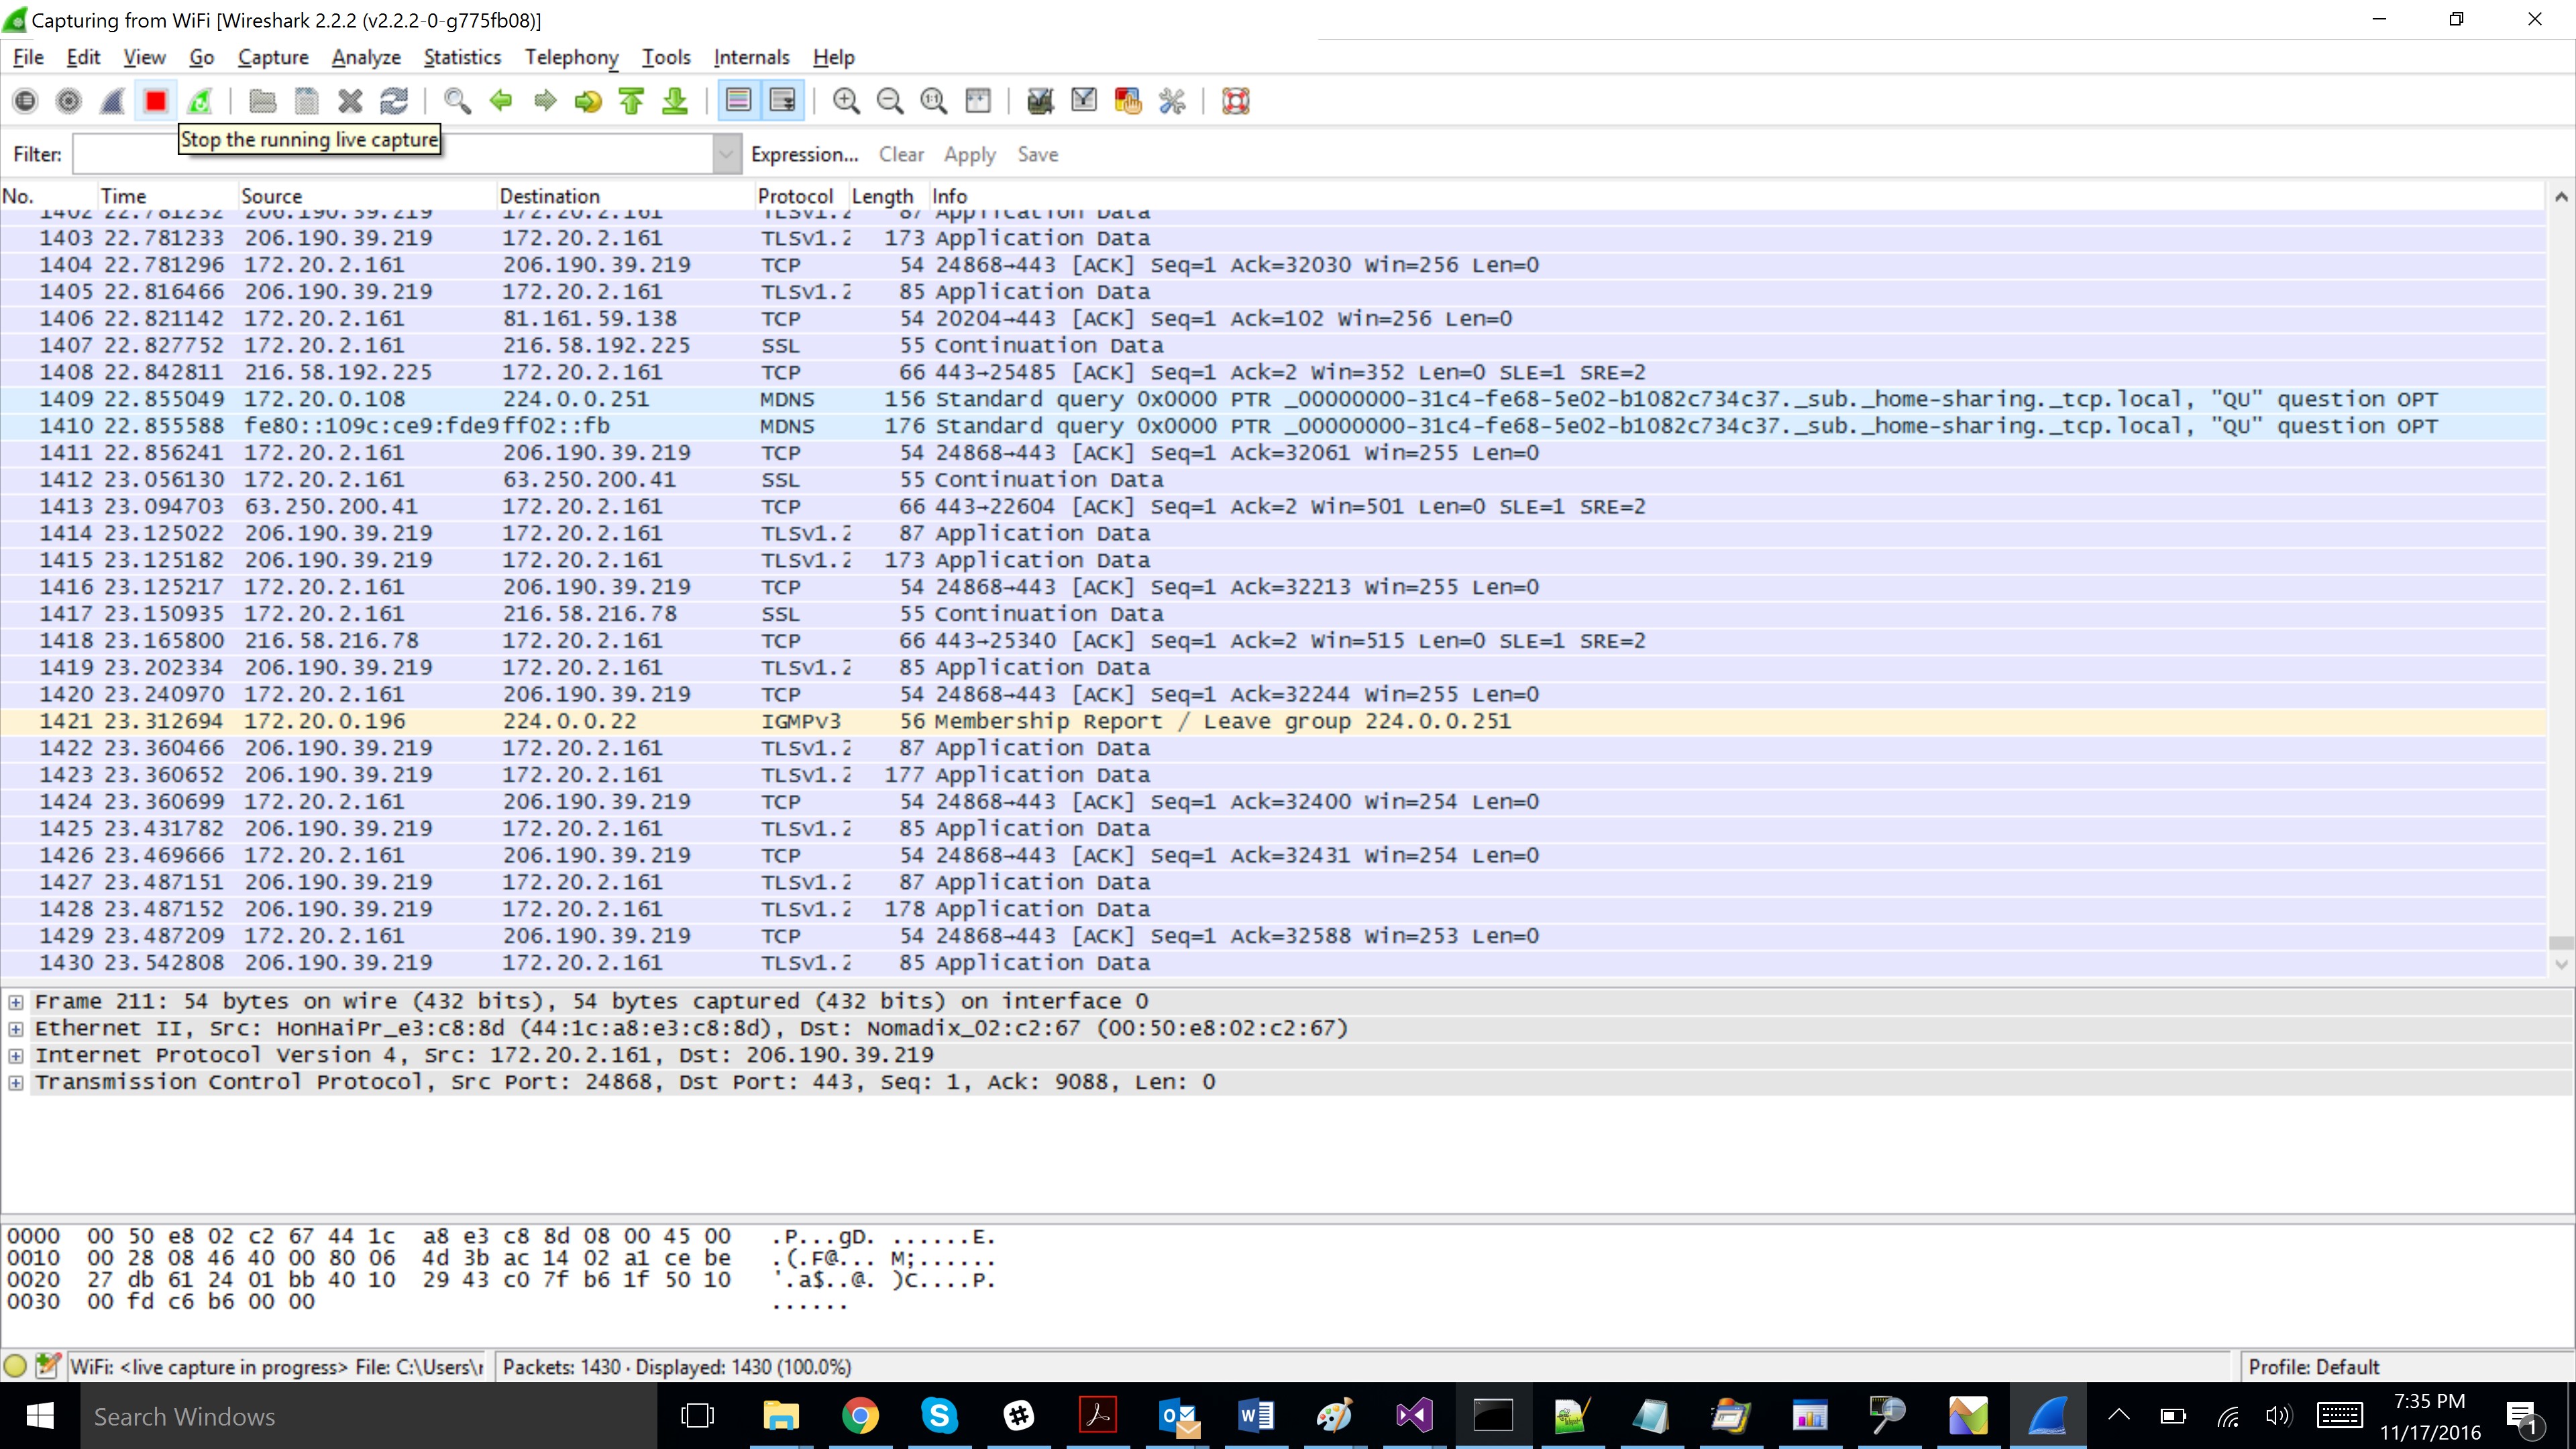
Click the Start button and run Winhttp.exe. After Winhttp.exe stops, click the Stop button in Wireshark.
This way you have obtained a traffic capture while winhttp.exe was running. Viewing the code for winhttp.exe, it can be noticed that it makes a request to www.sociouman-usamvb.ro. Use the ping command to get the IP address for this url.
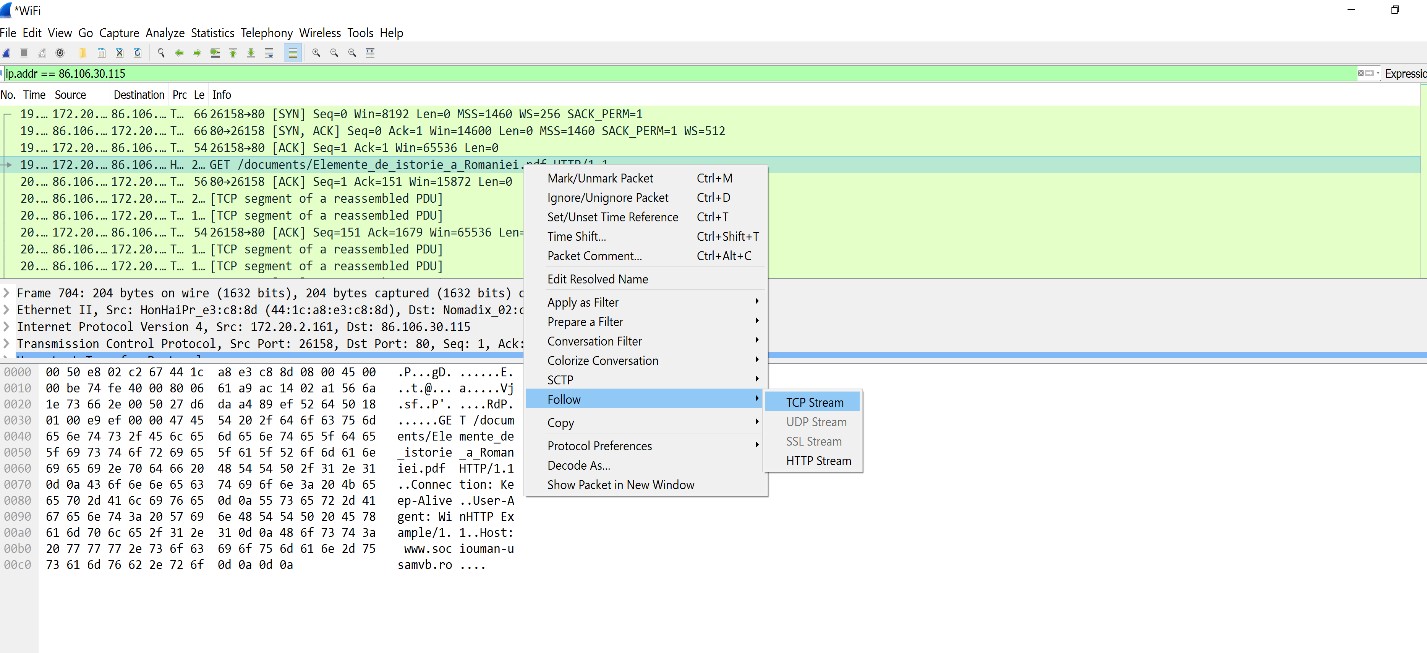
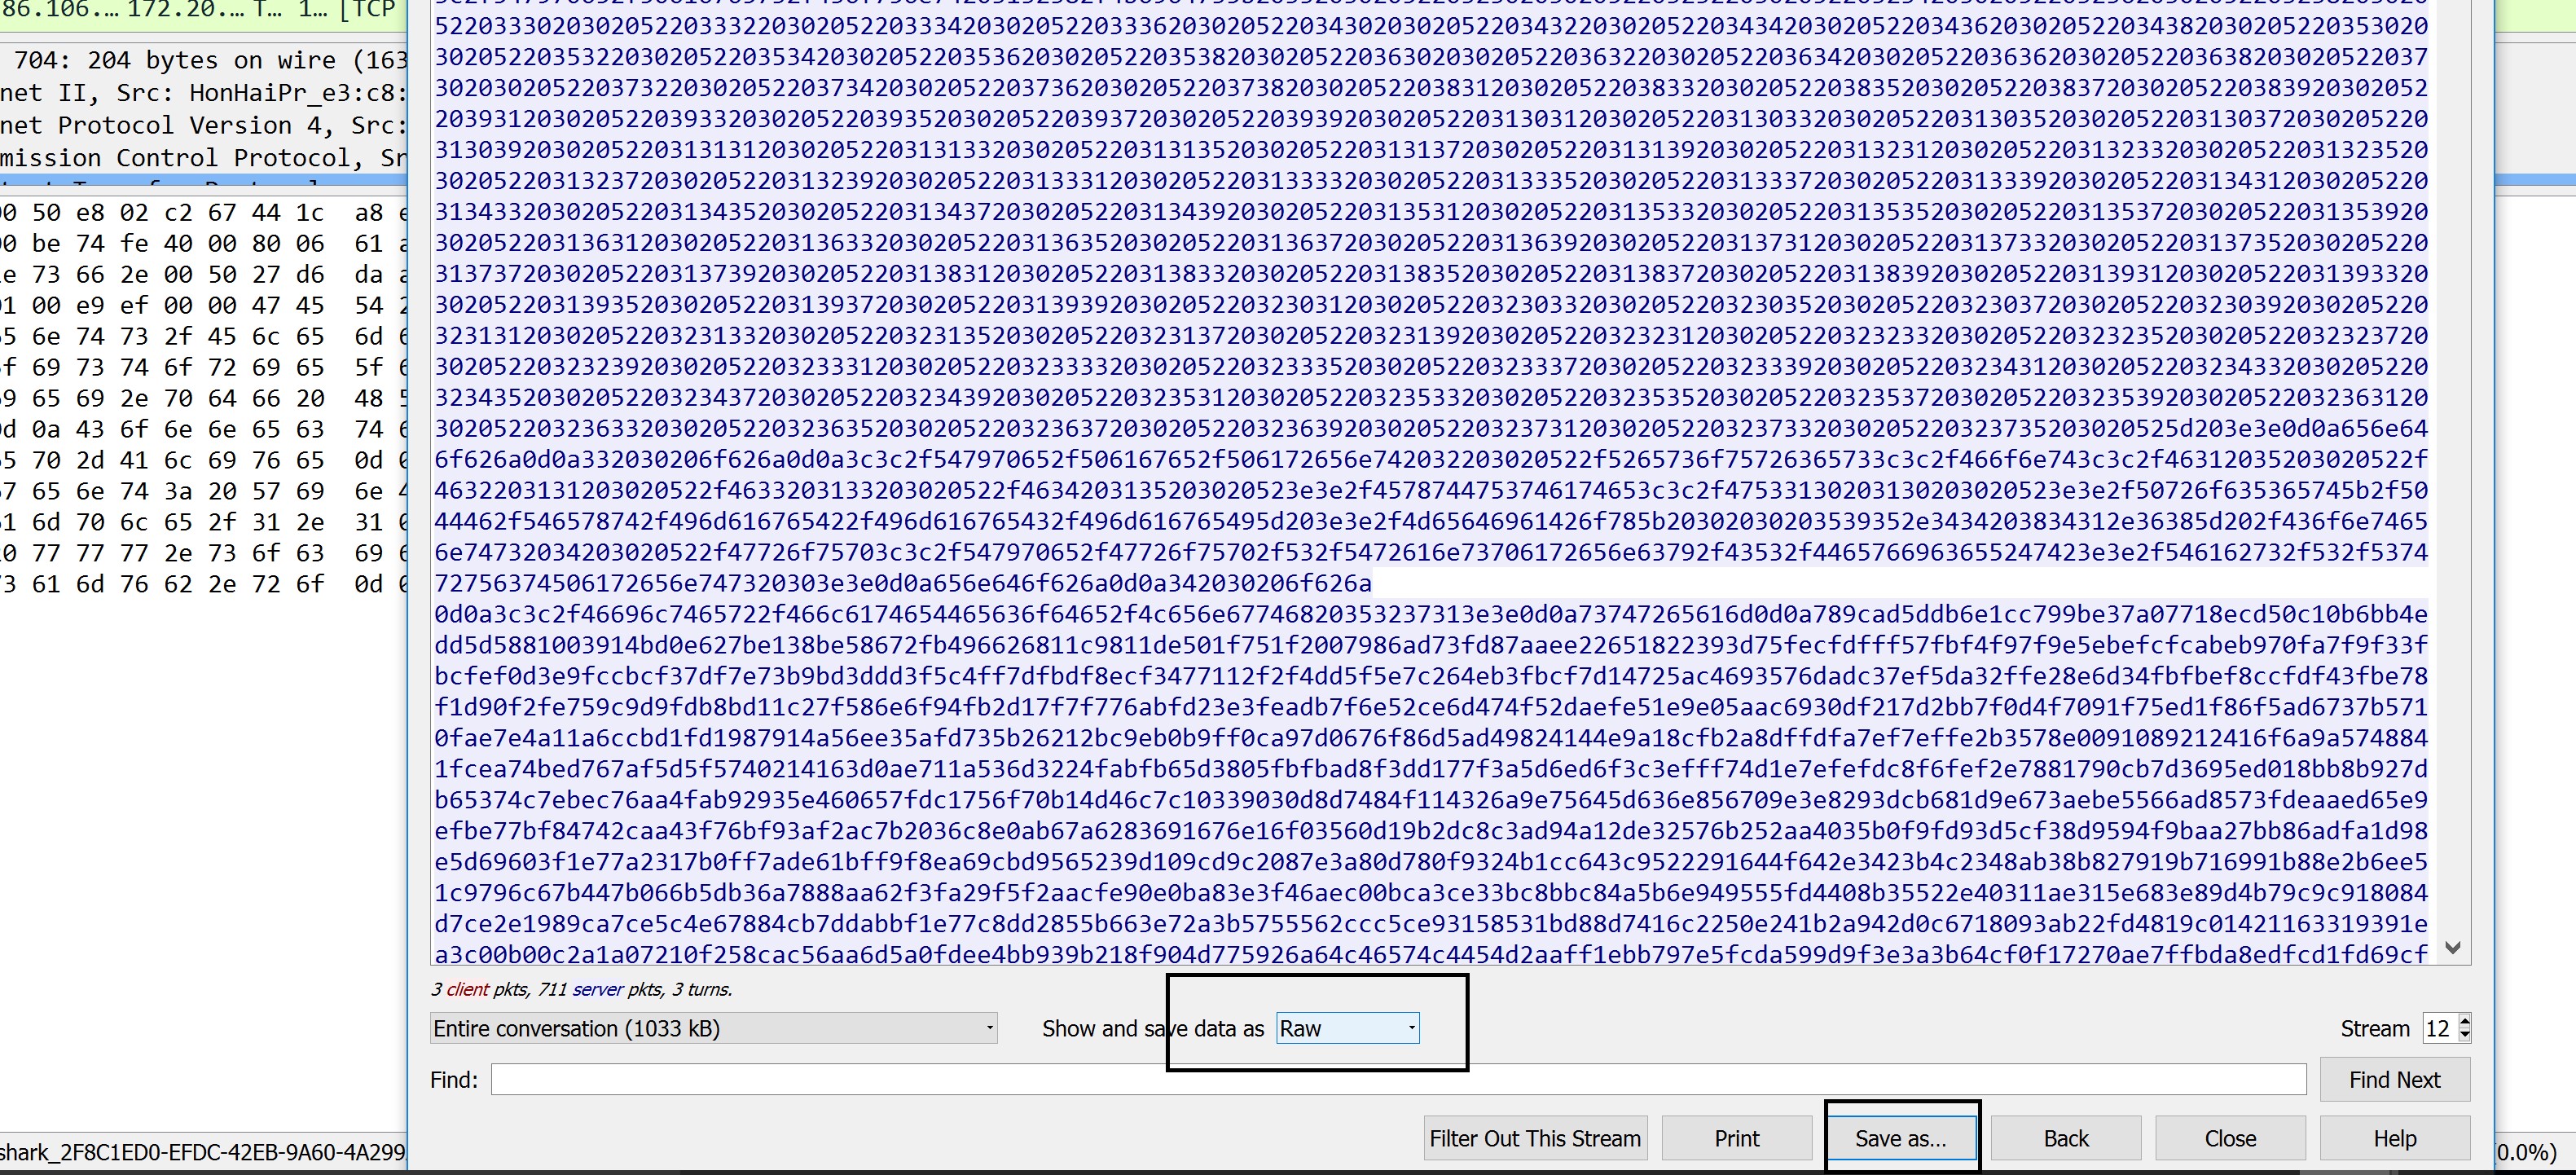
Switching back to Wireshark, add a filter for ip.addr = 86.106.30.115 (make sure to use the IP address identified using ping command). Right click Get documents and choose Follow TCP Stream.
In the bottom part of the Wireshark window, at the ”Show and save data as” option choose “Raw”. Save the capture (using the “Save as” button) as ”my.pdf”.
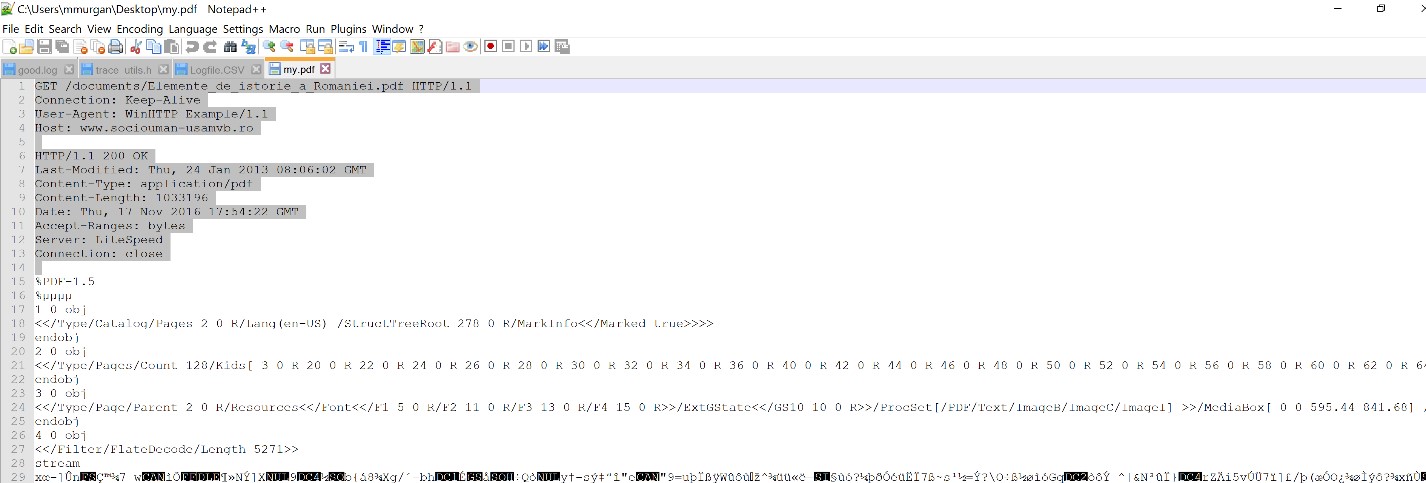
Use Notepad++ to open the my.pdf file and remove the headers as shown in the screenshot below.
Save it, close Notepad++ and double-click on the newly saved file (my.pdf).


