This is an old revision of the document!
01. [30p] RAM Monitoring
Using Windows Performance Recorder, run a program that allocates 1MB of memory every 100 milliseconds for a while and then stops. After the program stops, save the capture, open it in Windows Performance Analyzer and analyze the Virtual Memory Snapshots graph. What conclusion can we draw by looking at the memory usage of the process that is running our program?
Using VMMap, inspect the memory spikes generated by running the same program.
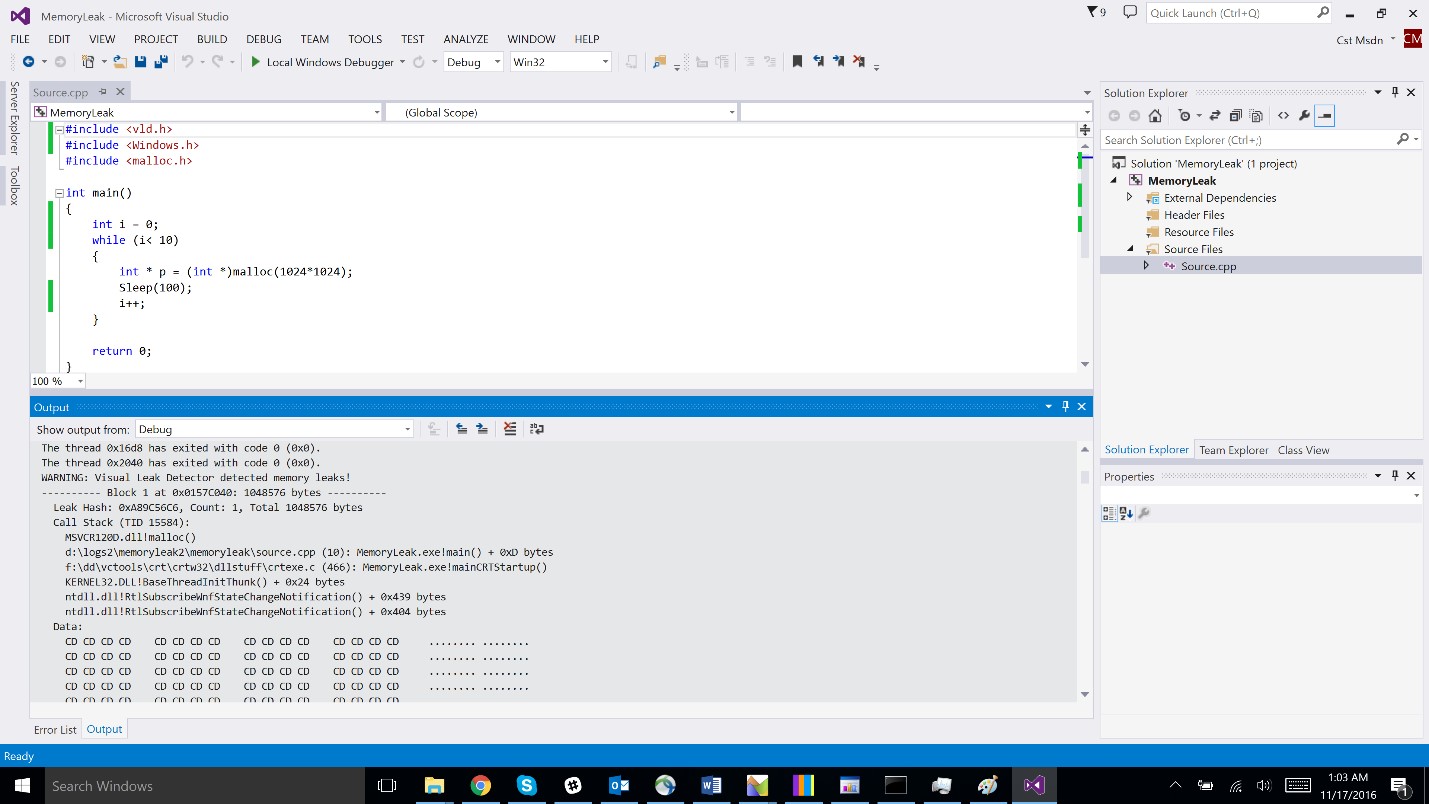
After installing, it requires including the vld.h file. When writing the code, the following functions need to be overwritten: malloc, free, new, and delete. This allows each memory allocation and deallocation to be tracked. All the detected leakages (having an allocation that is not followed by a deallocation) will be saved in a log file that can be viewed after the program stops running. In the bottom part of the screenshot shown below, it can be noticed where the allocation took place and that it is not followed by a deallocation.
⠀


