This is an old revision of the document!
Lab 08 - I/O Monitoring (Windows)
Objectives
- How to determine the root sources of having intensive disk usage/RAM/CPU and intensive networking using Task Manager (Processes, Performance, App history, Start-up, Users, Details, Services).
- Analyzing performance issues due to intensive disk use using Windows Performance Recorder, Process Monitor and Process Explorer.
- Monitor the disk activity, identify who is generating it and how to figure out the issue by looking at the pdbs and the code.
Introduction
Since computers started to surface, for many people it was a mystery what was happening behind the screen and it seemed magical when it wasn't working and even more magical when it was working. Since Linux is open-source, all sorts of tools appeared over time to analyse problems when they came up. On Windows on the other hand, the system being closed made it harder for tools to appear.
The first tools were provided by Sysinternals. These were written by Mike Rusinovich, who chose to make public tools such as “File monitor” and “Registry monitor”, which were later combined into “Process monitor”. The tools were so good that even Microsoft's support teams were using them. Seeing their usefulness and appreciating the know-how of their operating system, Microsoft decided to buy Sysinternals, so now the original website redirects to https://technet.microsoft.com/en-us/sysinternals (outside Romania it probably redirects to a different link due to localization reasons that consider the language of the country where redirection is made).
On this website can be found some of the tools that will be used in this tutorial - Process Monitor, Process Explorer, VMMap, Autoruns. Starting with Windows 7, Microsoft has begun to invest more and more in the performance of the system and in ways to monitor the system's performance. Some tools already existed since Windows 2000, but they were only used internally.
Tutorials & Tasks
Task Manager
Shows the process name responsible for constant disk thrashing either by reads or writes.
To start Task manager use the shortcut: Ctrl + Shift + Esc.
Tabs description:
- Processes tab shows all the running processes and their current resource usage in terms of CPU, Memory, Disk and Network.
- Performance tab shows the usage level of the computer's main resources in the last 60 seconds.
- The App history tab was first added to Windows 8, and it shows the resource consumption of metro applications. Metro applications are touch-screen-friendly applications written especially for Microsoft's WinRT programming interfaces.
- The Start-up tab shows all the applications that start at start-up, (or at least in Microsoft's vision - this will be further detailed in the Autoruns section), and their impact on the boot time. It is helpful to check this tab in case your computer takes a long to to start up.
- Users tab shows the resource consumption of every logged in user.
- Details tab shows details for each process - pid, status, the user under which it runs. Right-clicking the column headers bar, offers the possibility to add or remove columns. The following columns: Handles, Threads, Image Path Name and Command Line are very useful: the first one (Handles) when investigating a handle leak, the second one (Threads) in the case of investigating processes that create too many threads, the third one (Image Path Name) to find out the path from where the process was started, and the last one (Command Line) to find out the parameters with which it was started.
- Services tab shows the service status. A Windows service can be considered similar to a Linux daemon: a process without a visual interface, offering services to user-created processes.
Conclusion:
- Task Manager can be used to identify which process uses a lot of RAM, CPU, accesses the disk many times or generates a lot of traffic on the network at a certain moment (Services tab). However, it does not offer information if in the long run, that same process is the one that generated the slowdown of the system. It does offer some information for longer periods of time, in the Start-up tab, which shows what process had higher impact at start-up, but does not specify the area that was impacted (disk space, RAM, CPU).
- You can sort by I/O read or I/O Writes, but no option to sort the results by Total I/O (combined Read & Write).
- TODO: insert video here
01. [20p] Task Manager
- Watch the video and go through the tutorial
- Which program is constantly reading or writing to your hard disk?
![]()
![]() NON-DEMO TASK
NON-DEMO TASK
How to:
- Open Task Manager, and select the Details tab.
- Right-click on the column header (Name, PID, Status etc) and click Select Columns.
- Enable the following checkboxes and click OK.
- Next, sort the listings by I/O Read bytes and see which application is generating the maximum I/O (in bytes/sec). Similarly, sort by I/O Write bytes to see which program is writing to the hard disk continuously.
- Once you identify the program, decide if you need the program or not. Leave it as it is if the I/O operations are justified. Else, remove the program or consult its documentation to tweak the settings if any. For instance, one of your browser extensions may cause high disk or CPU usage. You need to isolate the extension, add-on or the browser’s feature causing the trouble.
Windows Performance Recorder
Installing Windows ADK will install Windows Performance Recorder. Check by clicking the windows button and typing “windows performance recorder”.
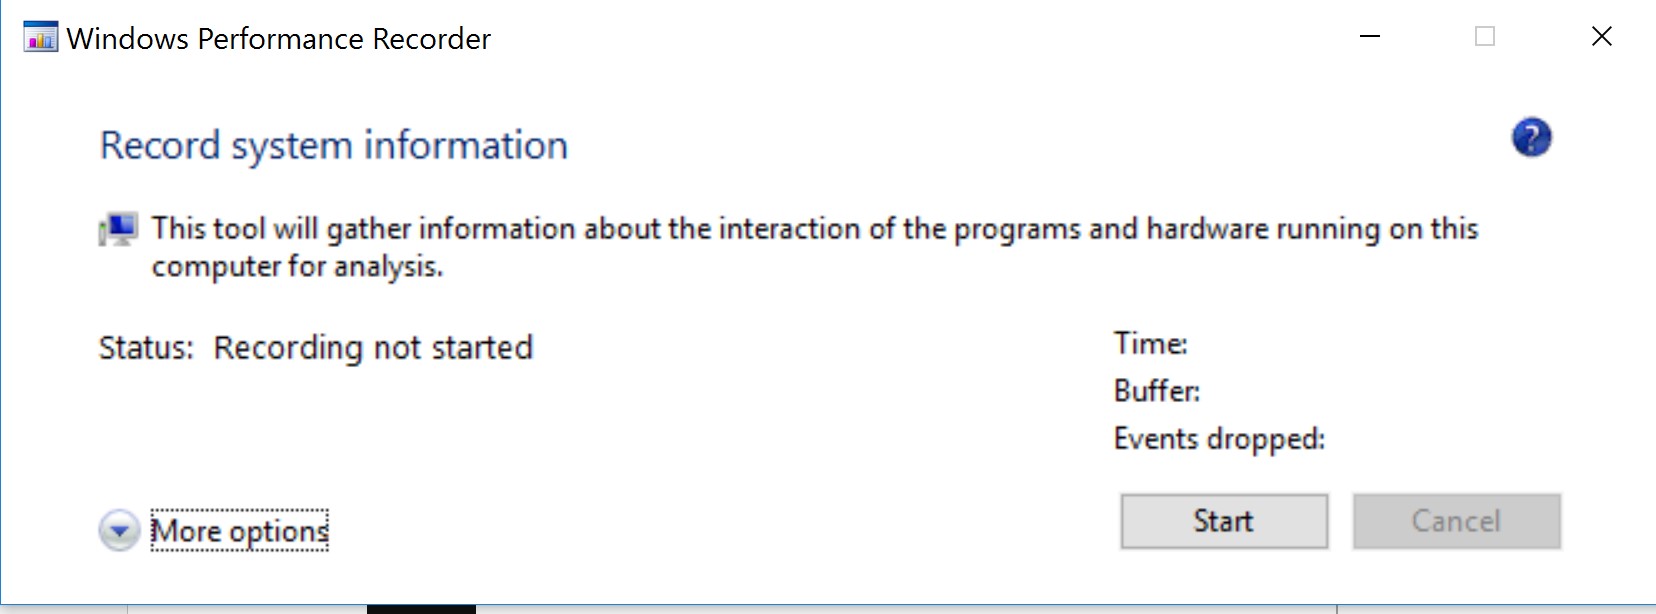
Start Windows Performance Recorder by pressing Enter. You will see the following:
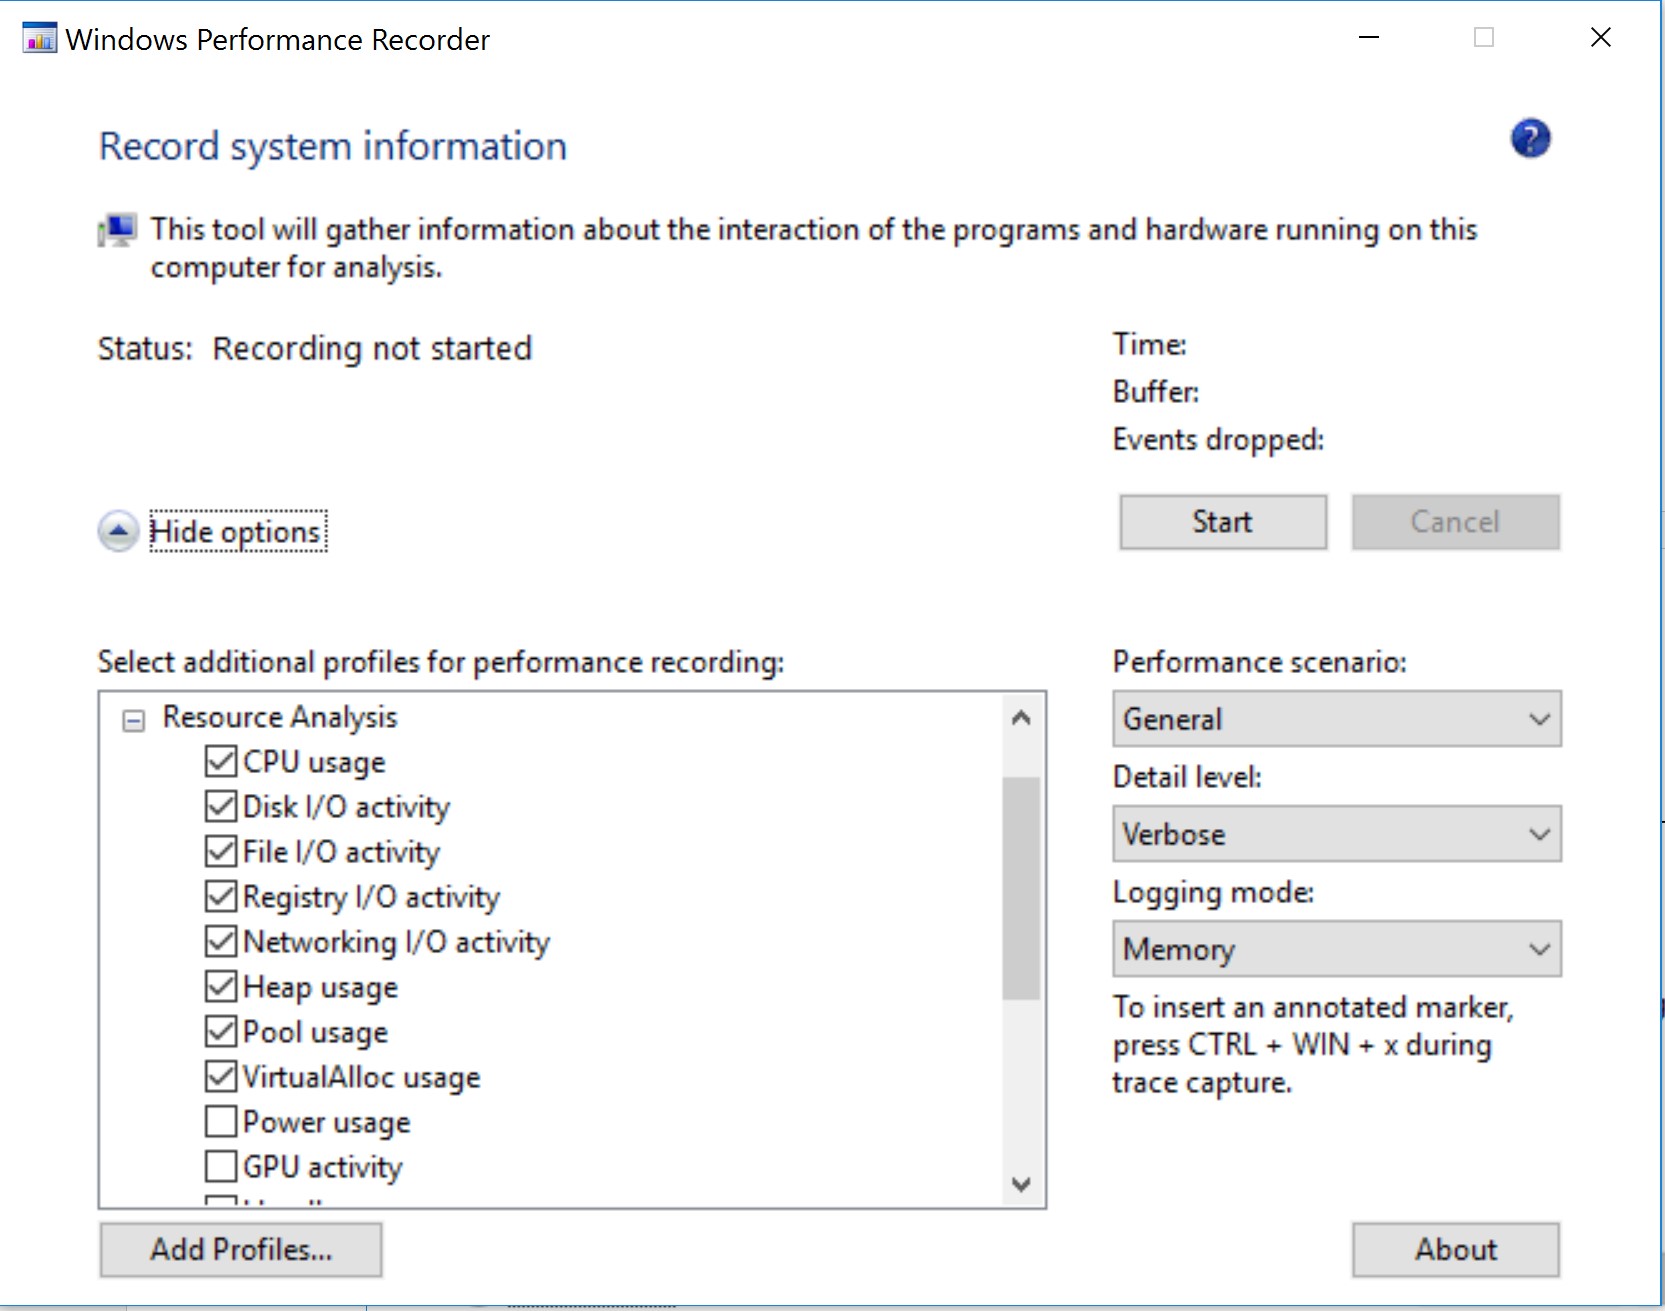
Click the More options button to get the list shown in the screenshot right below.
Make sure that you select the same check boxes as in the screenshot, but do not click start just yet. Create a new directory and copy the Logs.exe and GoodLog.exe files into this directory. The behaviour of these two executables is similar to logging applications that write logs to the disk. Open a terminal and change the path to the directory where you copied the files.
Start Windows Performance Recorder and right after run GoodLog.exe and then Logs.exe. Once the two applications finish running, click the Save button in Windows Performance Recorder.
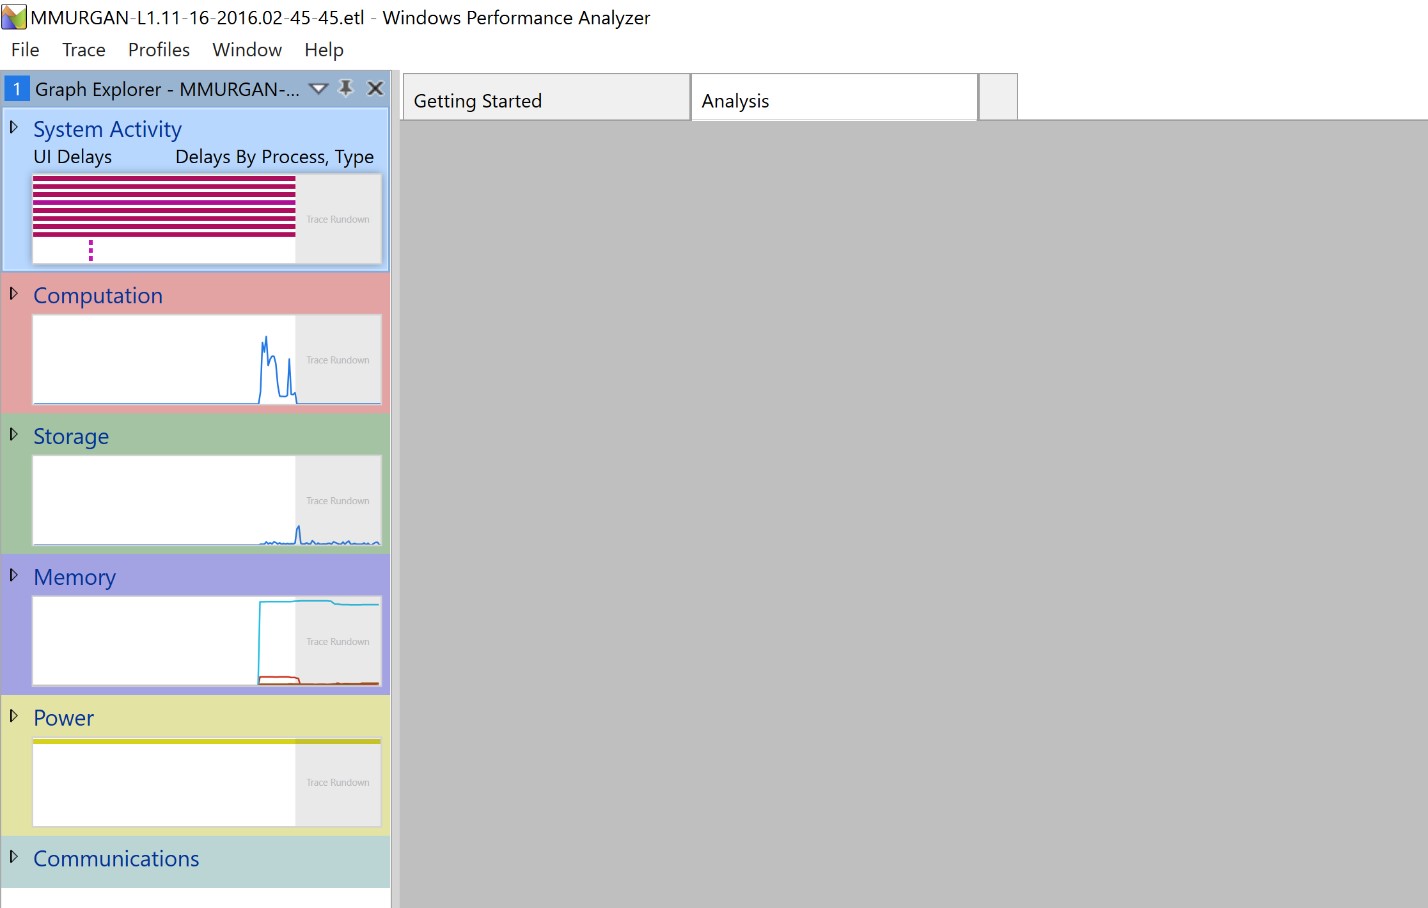
After the capture is saved, the Open option will become available in Windows Performance Analyzer. When clicking the Open button it should open a window such as the one below.
Double clicking on Storage should display the following window. Analyse the resources.
In the upper-left corner of the newly opened window it can select Disk Usage, Utilization by Disk. Click on Utilization by Disk and select: Utilization by Process, Path Name, and Stack. This will generate the following output.
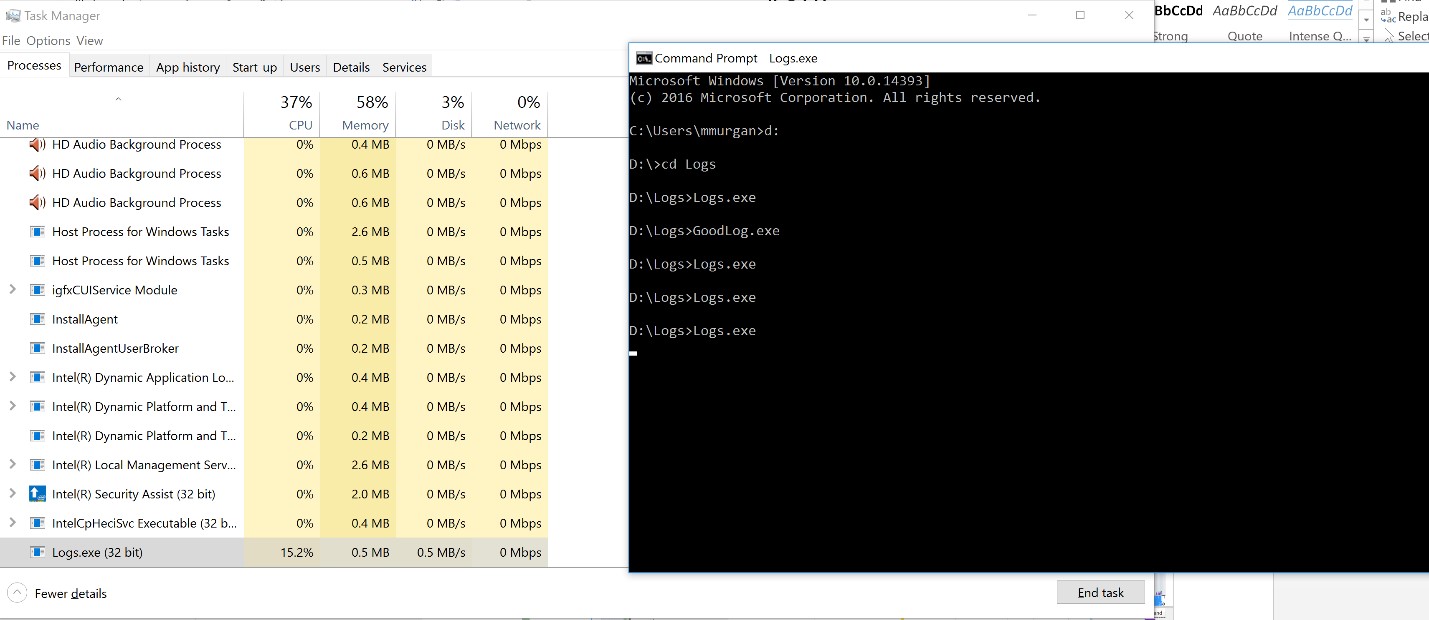
The graph looks interesting in Task Manager. Processes can be selected for observing their activity on the disk. It can be noticed that our processes are not shown. Run Logs.exe again while keeping Task Manager on.
Conclusions:
- This shows that there is activity on the disk. The question is why doesn't Windows Performance Analyzer show it. The way Windows Performance Recorder records activity is based on events generated by the Windows kernel. It registers to track the events, listens to them, and during the recording period it constantly samples which process uses which resource at the time of sampling.
- It sums up the number of time that a process was caught doing something. In our case, the two processes want to write to the disk, but they are not the ones that get to do the actual writing. They tell the system that they want to write, and the System process schedules the writing. The reason for this is targeting a more efficient disk writing, as the System process is trying to minimise the impact to the disk. This is why our process's writing is passed over to the System process.
TODO: insert video here
02. [20p] WPR and WPA
- Watch the video and go through the tutorial
Process Monitor
Process Monitor is an excellent troubleshooting tool from Windows Sysinternals that displays the files and registry keys that applications access in real-time. The results can be saved to a log file, which you can send it to an expert for analyzing a problem and troubleshooting it.
How to Use Process Monitor to Track Registry and File System Changes?
| Step 1: Running Process Monitor & Configuring Filters | |
|---|---|
| 1. Download Process Monitor from Windows Sysinternals site. | |
| 2. Extract the zip file contents to a folder of your choice. | |
| 3. Run the Process Monitor application. | |
| 4. Include the processes that you want to track the activity on. For this example, you want to include Notepad.exe in the (Include) Filters. | |
| 5. Click Add, and click OK. | |
| 6. From the Options menu, click Select Columns. | |
| 7. Under “Event Details”, enable Sequence Number, and click OK. |
| Step 2: Capturing Events | |
|---|---|
| 8. Open Notepad. | |
| 9. Switch to Process Monitor window. | |
| 10. Enable the “Capture” mode (if it’s not already ON). You can see the status of the “Capture” mode via the Process Monitor toolbar. | |
| 11. The highlighted button above is the “Capture” button, which is current disabled. You need to click that button (or use Ctrl + E key sequence) to enable capturing of events. | |
| 12. Cleanup the existing events list using Ctrl + X key sequence (Important) and start afresh. | |
| 13. Now switch to Notepad and try to reproduce the problem. | |
| 14. To reproduce the problem (for this example), try writing to HOSTS file (C:\Windows\System32\Drivers\Etc\HOSTS) and saving it. Windows offers to save the file (by showing the Save As dialog) with a different name, or in a different location. So, what happens under the hood when you save to HOSTS file? Process Monitor shows that exactly. | |
| 15. Switch to Process Monitor window, and turn off Capturing (Ctrl + E) as soon as you reproduce the problem. Important Note: Don’t take much time to reproduce the problem after enabling capturing. Similarly turn off capturing as soon as you finish reproducing the problem. This is to prevent Process Monitor from recording other unneeded data (which makes analysis part more difficult). You need to do all that as quickly as you can. |
| Step 3: Saving the Output | |
|---|---|
| 16. In the Process Monitor window, select the File menu and click Save. | |
| 17. Select Native Process Monitor Format (PML), mention the output file name and Path, save the file. | |
| 18. Right-click on the Logfile.PML file, click Send To, and choose Compressed (zipped) folder. This compresses the file by ~90%. Look at the graphic below. You certainly want to zip the log file before sending it to someone. |
TODO - insert video here
02. [30p] Process Monitor
logs-final.7z: parola
HandleLeak.7z: parola7
Task.7z: parola17
[10p] Task A - Checking logging file
- Looking at the logs created by the two apps in Process Monitor - bad.log, good.log - they are identical, but Logs.exe has a significantly longer running time compared to GoodLog.exe. Start Process Monitor.
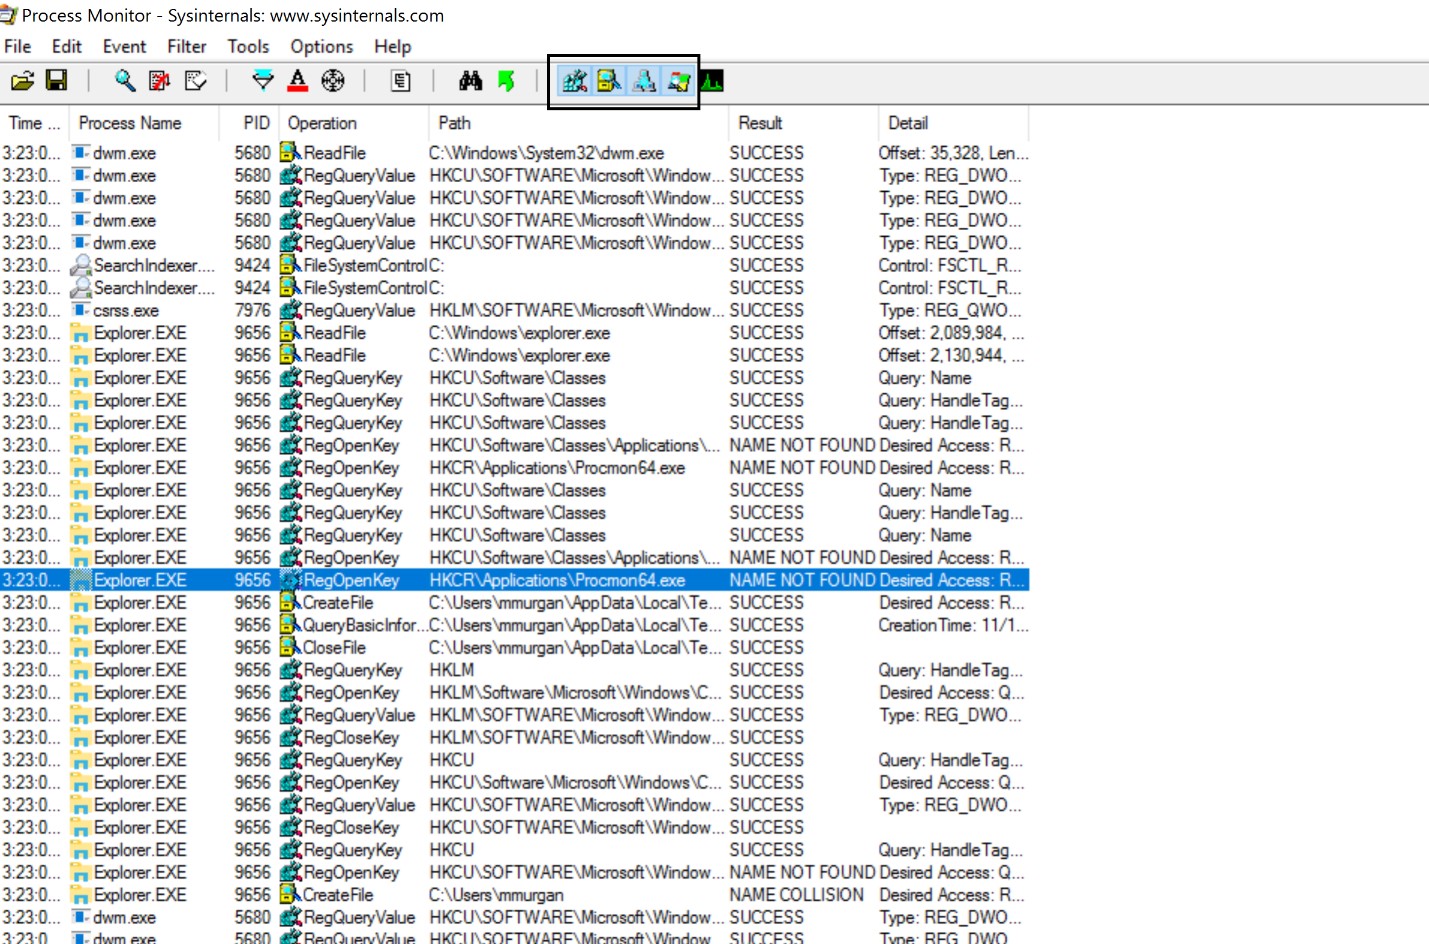
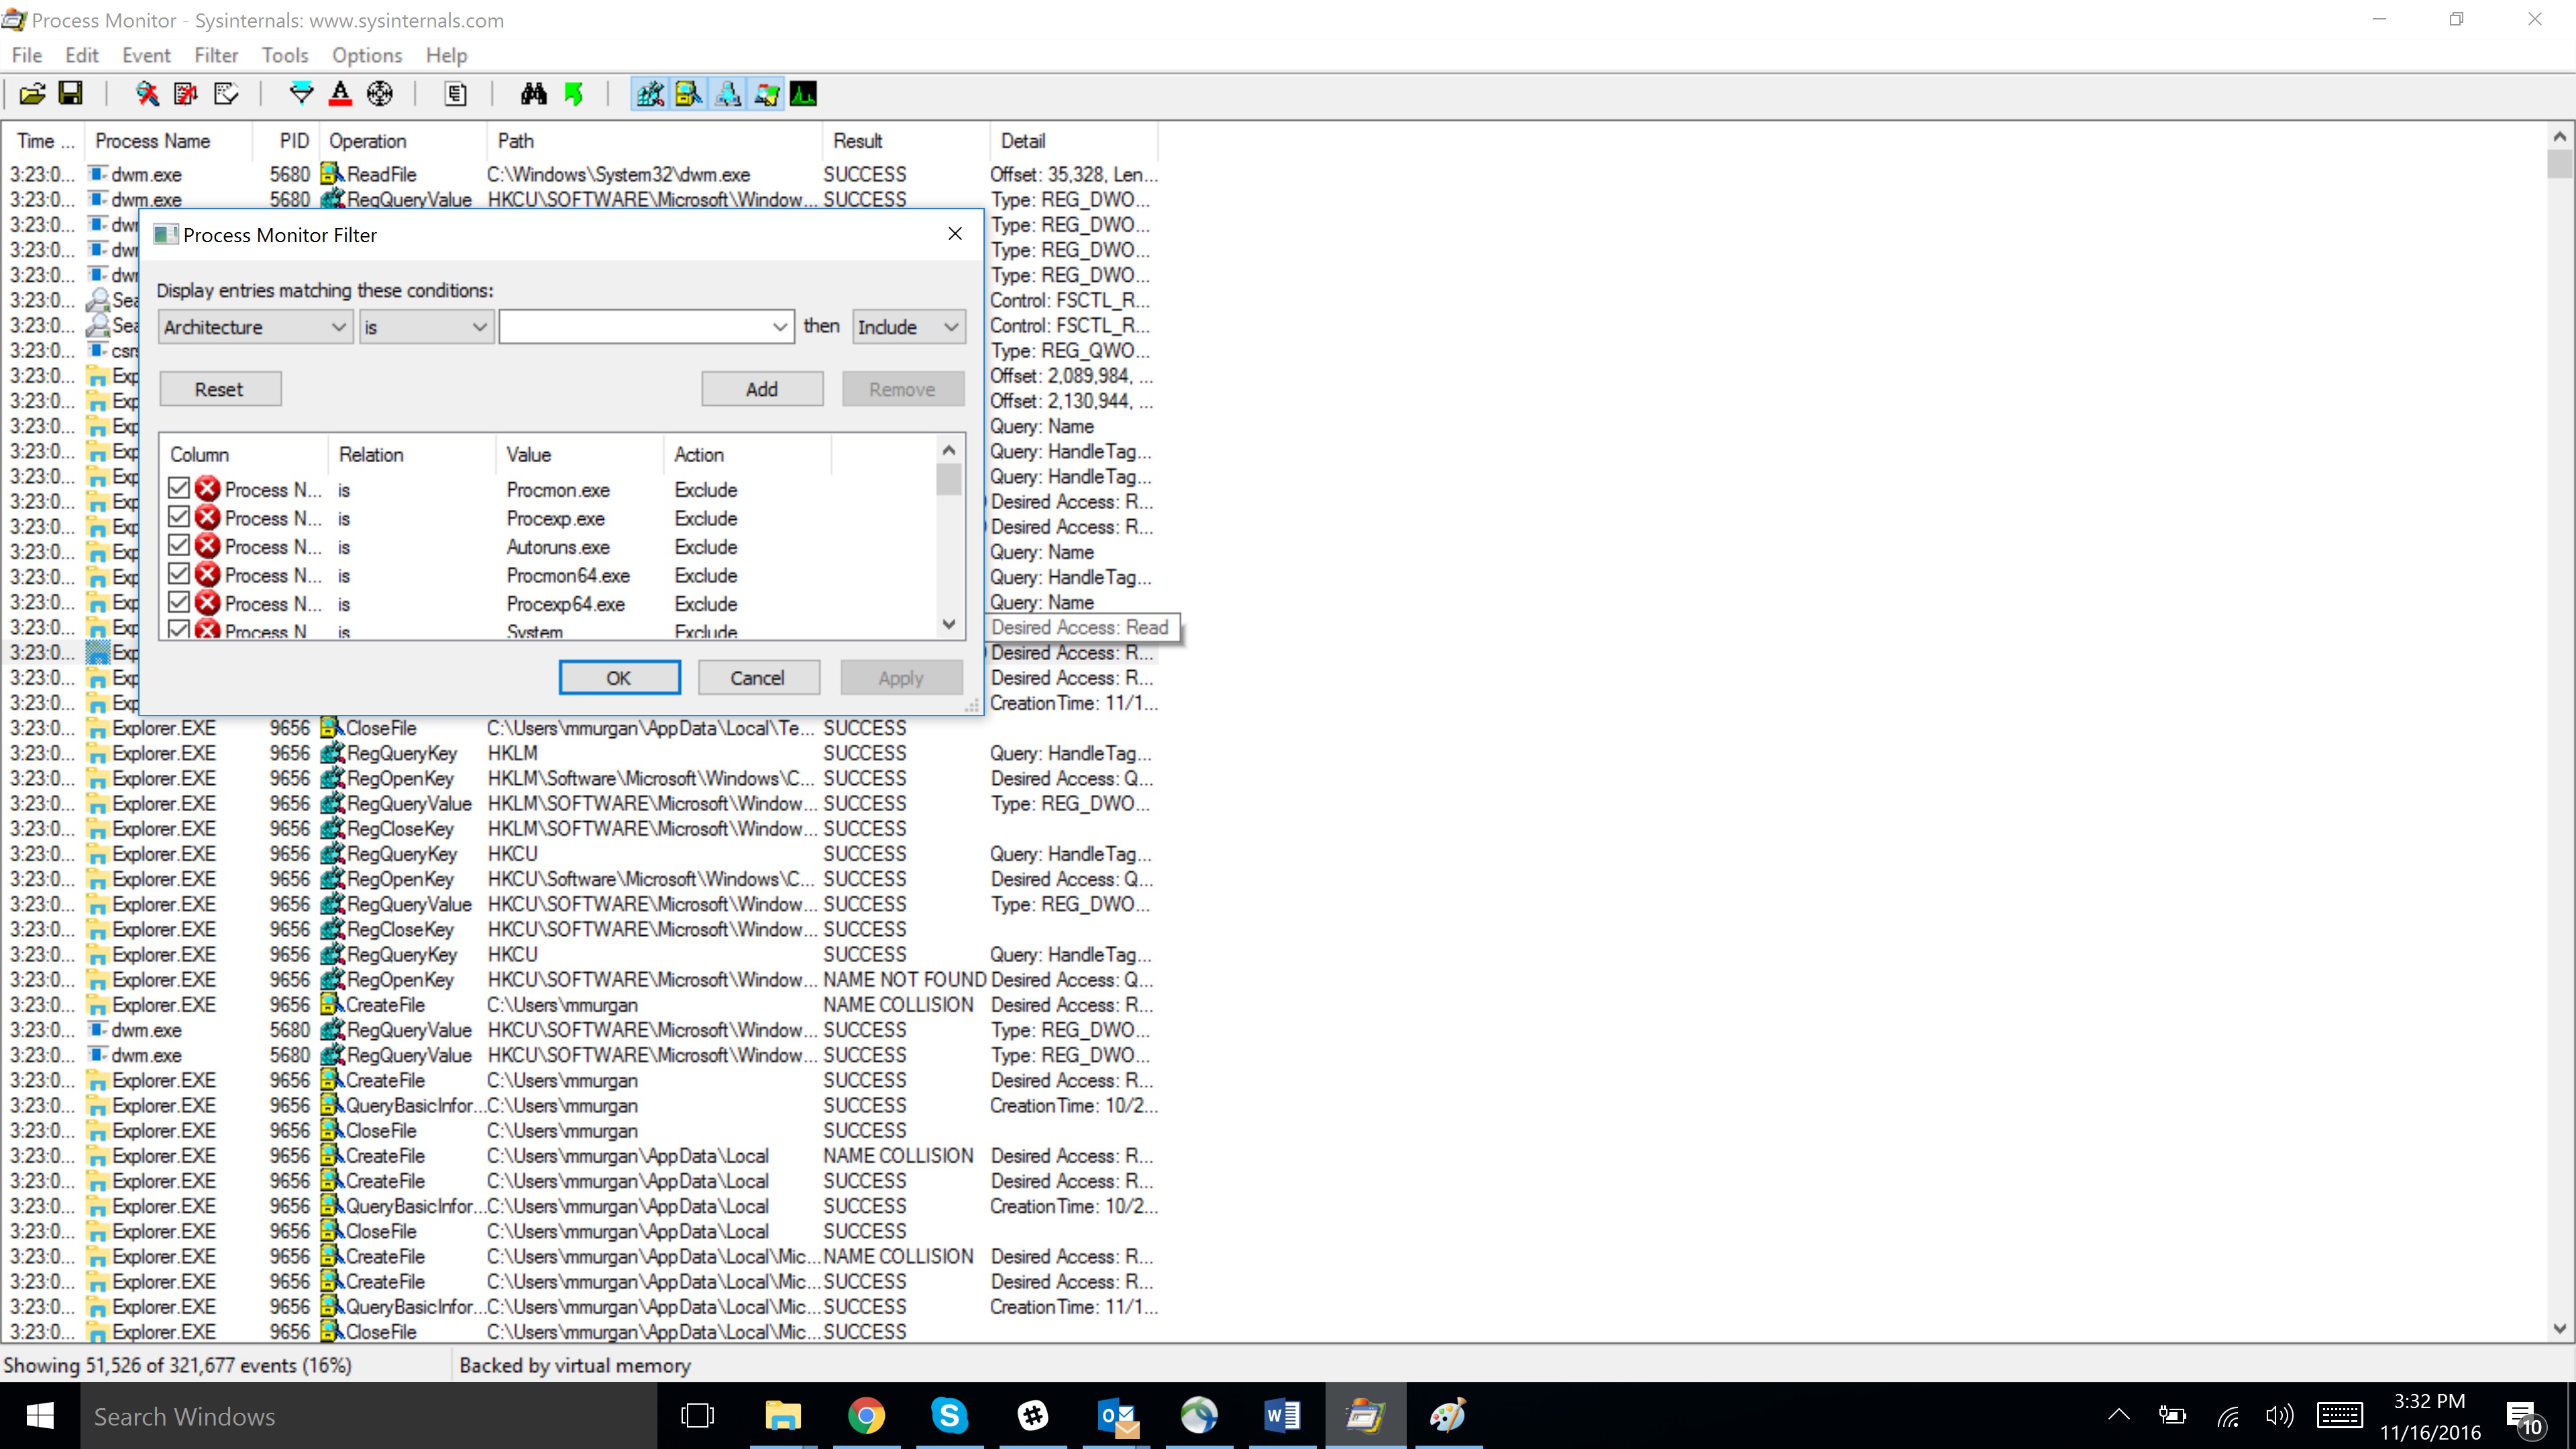
- If the 4 buttons in the black area on the upper part of the window are selected, Process Monitor will display the activity (in this order) for: registry, files, networking, process and thread activity. By unchecking them, the corresponding events will be no longer displayed. In the menu bar there is the Filter field. If selected, it will trigger a dropdown menu that contains another Filterfield. If this second Filter field is selected, it will open the window shown below. Replicate this on your computer.
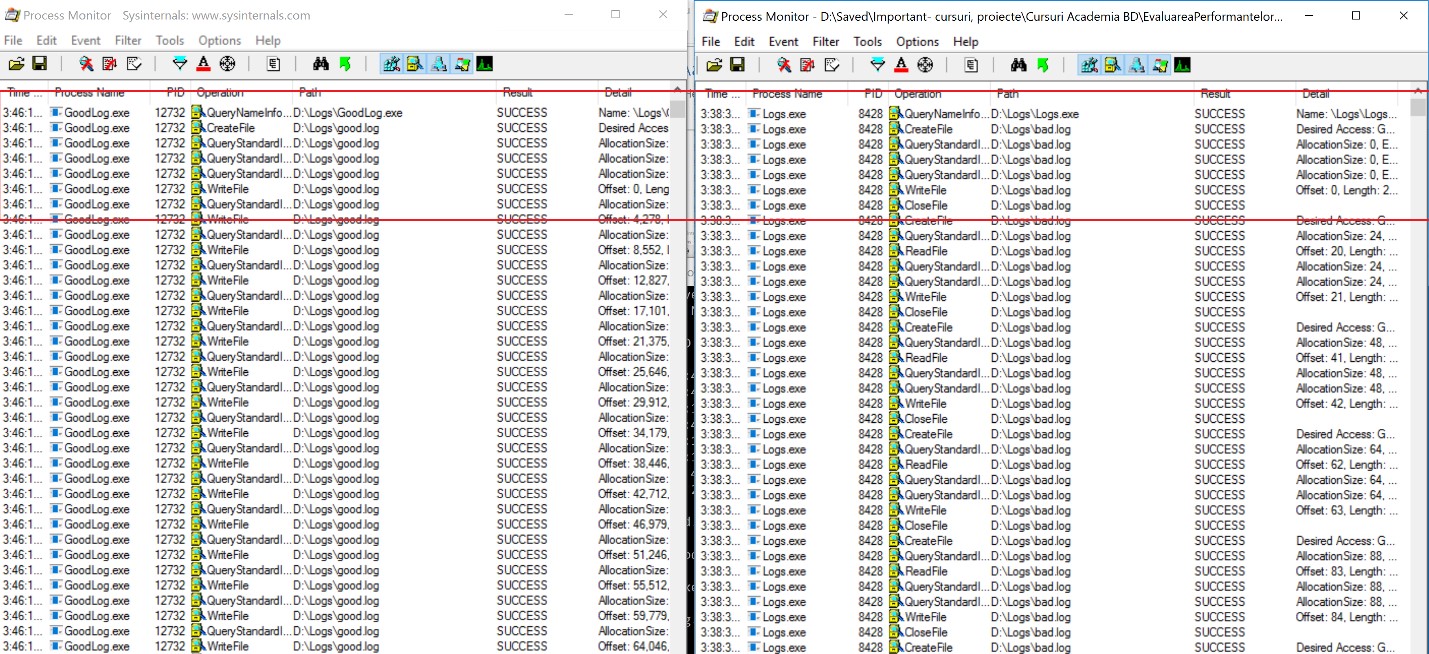
- From the two dropdown menus in the upper part of the context window, select ”Process Name” instead of ”Architecture” and ”is” instead of ”contains”. In the text filed add Logs.exe, click the Add button and then the OKbutton. Open the terminal and run Logs.exe. After the program is done running, save the Process Monitor capture. Use Ctrl + X to reset all the events captured in Process Monitor. Go to Filter → Filter area, double-click on the filter that was just added and change Logs.exe with GoodLog.exe, then click Add and Ok. Start GoodLog.exe and save the capture once the program finishes running. Scroll down in the two capture-logs until you notice the activity for bad.log respectively good.log.
- Notice the difference. On the left-hand side it is shown the faster logging process, and on the right-hand side the slower one. Look in the red highlighted area to see the difference. On the left-hand side the logging file is opened, followed by continuous writing, while on the right-hand side the file is opened and closed for every writing operation which explains the significant slowdown.
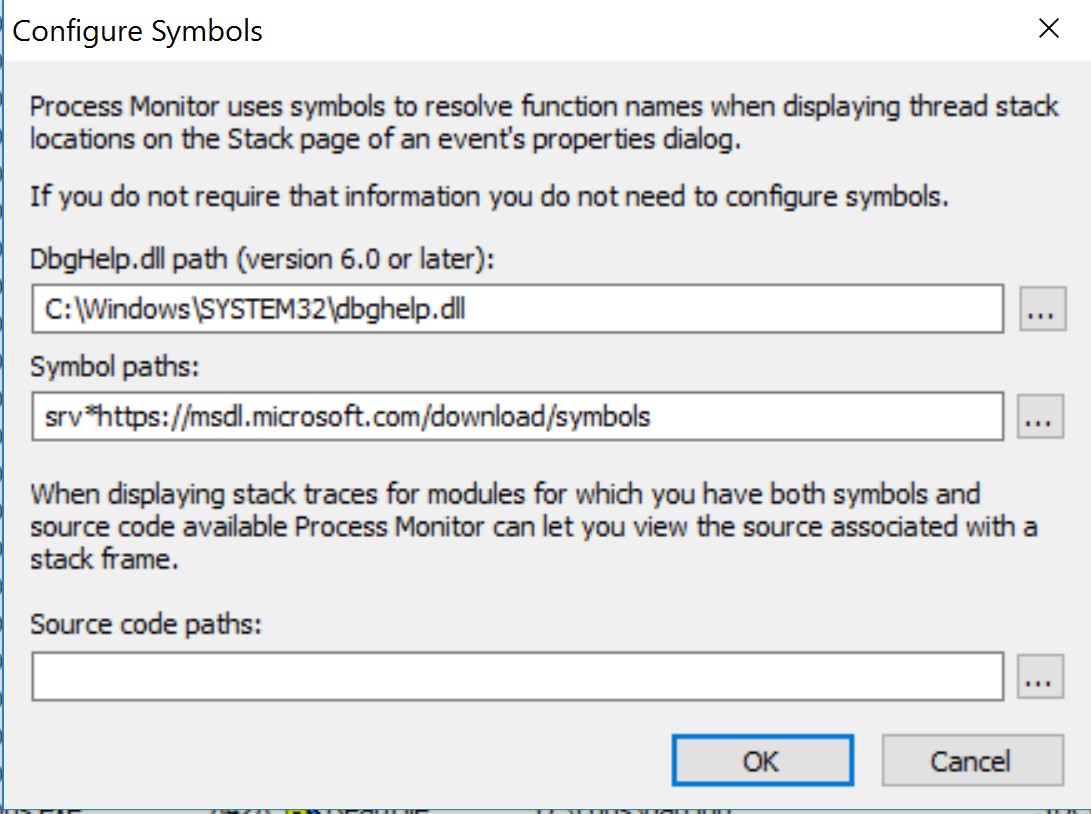
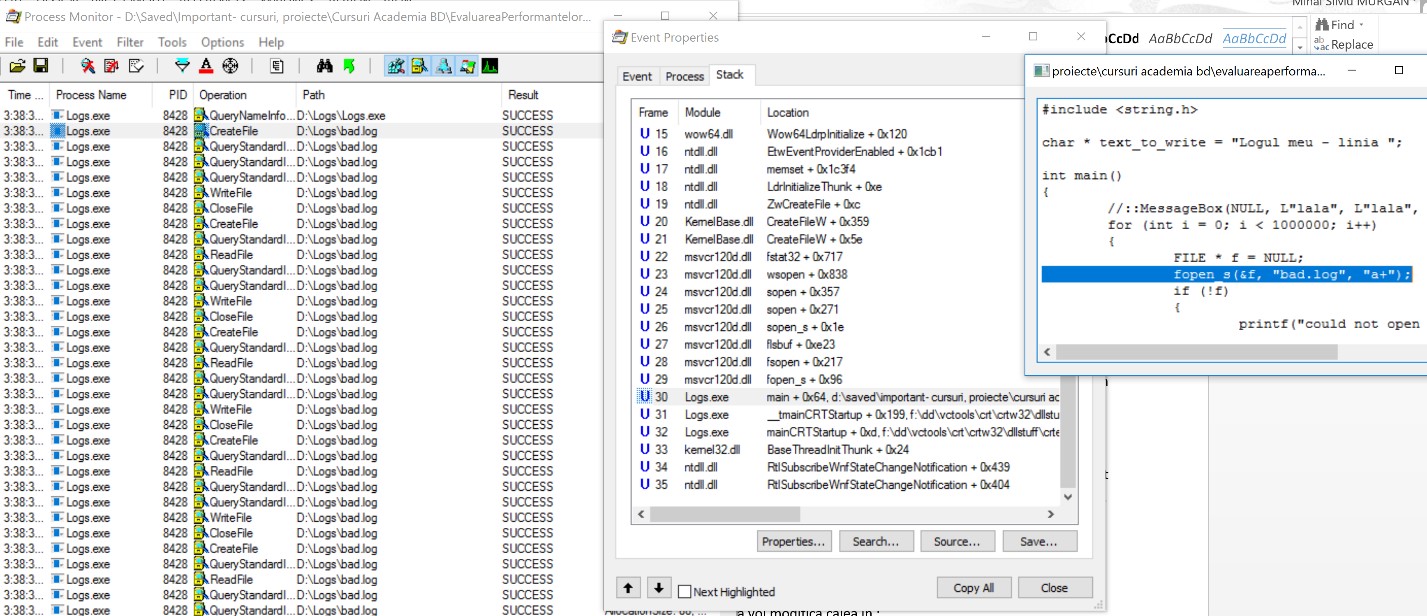
- To recap, Task Manager shows what processes use the disk intensively at the current time, Windows Performance Recorder / Windows Performance Analyzer show who used the disc during a longer time period, although they were showing the activity as belonging to the System process instead of our process. Using Process Monitor we could identify our processes' entire activity and we could determine why one is slower than the other. But what if we could find out which line in the code causes the problem? Go back to Process Monitor. Use the window of the badly written logging program (Logs.exe). Go to Options → Configure Symbols, which will open the window shown below.
- In the log (D:\Logs\bad.log) go to CreateFile. Double-click to open the Event Properties window. Choose the Stacktab, scroll down and you can notice that in the main function of main_bad_log.cpp, at line 12 the opening takes place. Click the ”Source” button to view the source code containing the issue.
[20p] Task B - Investigating a handle leak
![]()
![]() NON-DEMO TASK
NON-DEMO TASK
In logs-final.7z you have another example of two executables: good.exe and bad.exe. Both have the same outcome, the only difference being their running time (one of them is significantly slower). Identify the problem.
How to:
- A handle leak consists of a process that opens files and does not close them. On modern computers if this action is performed millions of times, the system may become unresponsive and will either experience an overall slowdown or the application that causes this will eventually crash. You may think that millions of handles are impossible to reach, so it is not worth paying attention to this problem. However, imagine that there are services running on servers for years. As an example, having a handle leak every 2 seconds amounts for over 10 million handle leaks in a year. How should such problems be investigated?
- Hint: Open up a terminal and run HandleLeak.exe. Check out the ”Details” tab in Task Manager after adding the ”Handles” column.
03. [30p] Process Explorer
![]()
![]() NON-DEMO TASK
NON-DEMO TASK
- It can be noticed that the number of handles keeps growing. This is clearly a problem, but how do we investigate it?
How to:
- Run it as administrator. It is similar to Task Manager. Select the process that you are interested in, namely HandleLeak, and press “Ctrl + H”.
- “Ctrl + H” opens a window under the ”Process” section that displays all open handles along with information about them. Thus it will display file handles, registry handles, threads handles, and so on. There is another view (Ctrl + D) that displays all the loaded dlls.
- So it can be noticed that the leaks are on the following file: D:\Logs\HandleLeak\leak.txt. This is very useful information, but it would be better to find out who is responsible for the leak in code. Run Process Monitor with a filter on HandleLeak.exe and to notice the stack where the leakage is happens.


