

This is an old revision of the document!
03. [??p] Tracy
TODO: intro & maybe GPU monitoring / GLFW frame recording
[??p] Task A - Compile the Server
Clone the Tracy project and jump into its root directory. Then, run the following commands to compile the Server component:
$ cmake -B profiler/build -S profiler -DCMAKE_BUILD_TYPE=Release
$ cmake --build profiler/build --config Release --parallel
So far so good. Once we're done with the integration of the Client into our demo application, the Server will collect the trace data and process it for us. But first things first…
[??p] Task B - Client integration
Go to lab_07/task_03/ where you will find a copy of the OpenGL application from our previous I/O monitoring lab. This version no longer has the tracking code that generated runtime statistics for you to plot.
The first step toward integrating Tracy with our OpenGL demo is to copy tracy/public/TracyClient.cpp in the project's src/ directory. Then, we're going to need access to some headers, so add -I${TRACY_DIR}/public to the CXXFLAGS variable in your Makefile.
Now that the compiler can find the headers, include tracy/Tracy.hpp in every source file that you want profiled (i.e., every other file in src/). Additionally, we must define the TRACY_ENABLE macro for the entire project in order for the profiler code to be compiled. Add -DTRACY_ENABLE to the CXXFLAGS in our Makefile.
Recompile the project and make sure you don't have any errors.
[??p] Task C - Add trace marks
Now that we have the Tracy client code compiled into our application, it's time to add some markers. Because we defined the TRACY_ENABLE macro at a global scale, the FrameMark macro has the following definition in Tracy.hpp:
#define FrameMark tracy::Profiler::SendFrameMark( nullptr )
Place this macro at the end of the main rendering loop in the main() function of our demo app.
Similarly, place the ZoneScoped macro at the start of each function that you want included in the trace.
[??p] Task D - Collect and visualize samples
Now that we've set up both the Server and the Client, it's time to test out Tracy. First, start tracy-profiler in your build directory from Task A. Hit the Connect button to listen for incoming connection from Clients on your localhost.
Next, start the demo application and hit ] a few times before exiting it. We want to generate a few events to identify on the Server.
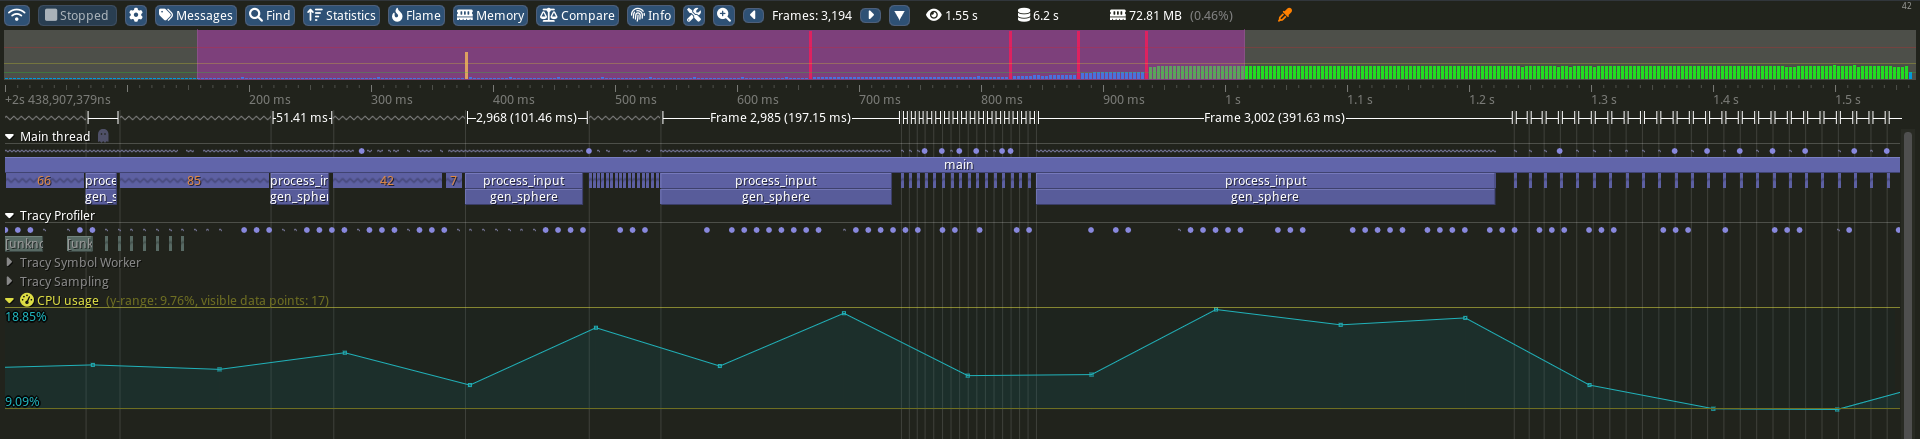
Because the Client that we integrated is bare-bones (i.e., cannot capture frames from the GLFW window, get GPU usage statistics, interpret DWARF symbols, etc.) the information seen in Figure 1 is limited in scope. However, we can point out how the duration of gen_sphere() becomes increasingly longer as we continuously double the amount of generated vertices. These function calls coincide with intervals of increased CPU activity. Also, notice how Tracy is able to unwind the call stack and determine that gen_sphere() is called as a result of processing input events in process_input(), inside the main rendering loop.
