03. [25p] Tracy
Tracy is a feature-rich profiler that functions based on a client-server paradigm. The Server component is standalone and is used to analyze in real-time data collected during the execution of a program. When first started, the server will listen of a user-specified interface (default: loopback iface) for incoming connections from clients. The Client component must be embedded into your application. In other words, you must consciously designate the regions that need to be analyzed and the metrics that you want observed. The client code will continuously collect runtime information and send it to the server.
In this exercise we will walk through the process of adding Tracy support in an existing application, namely the OpenGL demo from the I/O monitoring lab. Specifically, we will observe the impact that doubling the number of vertices has on the CPU and GPU.
Because time is short and we can't explore each feature of Tracy, check out this interactive demo offered by the authors as a web-based Server with a pre-loaded trace.
[5p] Task A - Compile the Server
Clone the Tracy project and jump into its root directory. Then, run the following commands to compile the Server component:
$ cmake -B profiler/build -S profiler -DCMAKE_BUILD_TYPE=Release
$ cmake --build profiler/build --config Release --parallel
So far so good. Once we're done with the integration of the Client into our demo application, the Server will collect the trace data and process it for us. But first things first…
[5p] Task B - Client integration
Go to lab_07/task_03/ where you will find a copy of the OpenGL application from our previous I/O monitoring lab. This version no longer has the tracking code that generated runtime statistics for you to plot.
The first step toward integrating Tracy with our OpenGL demo is to copy tracy/public/TracyClient.cpp in the project's src/ directory. Then, we're going to need access to some headers, so add -I${TRACY_DIR}/public to the CXXFLAGS variable in your Makefile.
Now that the compiler can find the headers, include tracy/Tracy.hpp in every source file that you want profiled (i.e., every other file in src/). Additionally, we must define the TRACY_ENABLE macro for the entire project in order for the profiler code to be compiled. Add -DTRACY_ENABLE to the CXXFLAGS in our Makefile.
Recompile the project and make sure you don't have any errors.
[5p] Task C - Add trace markers
Now that we have the Tracy client code compiled into our application, it's time to add some markers. Because we defined the TRACY_ENABLE macro at a global scale, the FrameMark macro has the following definition in Tracy.hpp:
#define FrameMark tracy::Profiler::SendFrameMark( nullptr )
Place this macro at the end of the main rendering loop in the main() function of our demo app.
Similarly, place the ZoneScoped macro at the start of each function that you want included in the trace. This will include everything that executes within the scope of that function to the server, once FrameMark is reached.
[5p] Task D - Collect and visualize samples
Now that we've set up both the Server and the Client, it's time to test out Tracy. First, start tracy-profiler in your build directory from Task A. Hit the Connect button to listen for incoming connections from Clients on your localhost.
Next, start the demo application and hit ] a few times before exiting it. We want to generate a few events to identify on the Server.
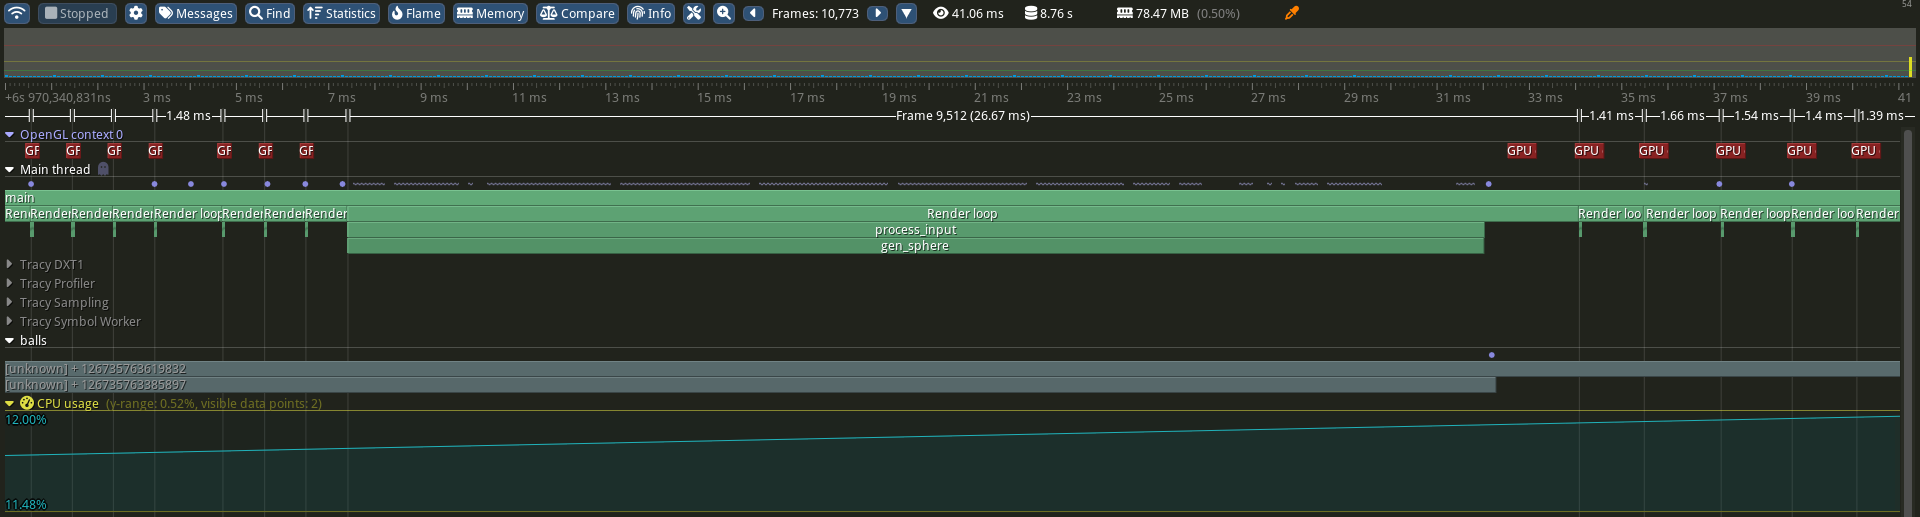
Because the Client that we integrated is bare-bones (i.e., cannot capture frames from the GLFW window, get GPU usage statistics, interpret DWARF symbols, etc.) the information seen in Figure 1 is limited in scope. However, we can point out how the duration of gen_sphere() becomes increasingly longer as we continuously double the amount of generated vertices. These function calls coincide with intervals of increased CPU activity. Also, notice how Tracy is able to unwind the call stack and determine that gen_sphere() is called as a result of processing input events in process_input(), inside the main rendering loop.
[5p] Task E - GPU sampling
Now that we have our CPU profiling set up, it's time to add GPU support as well. Following this task, we will be able to identify the time slices in which the GPU is performing computations to satisfy our OpenGL draw requests. In order to figure this out, we need to add three additional Tracy macros in our main() function. These macros are defined in tracy/TracyOpenGL.hpp, so include it.
TracyOpenGL.hpp uses some OpenGL constants that are defined in the GLAD header. Because this header is generated on a case-by-case basis (depending on OpenGL core version and required extensions), Tracy relies on the fact that the user had already included these definitions before including TracyOpenGL.hpp. So make sure you place this include after that of glad.h.
The three macros that you need to place inside the source code are as follows:
- TracyGpuContext: Must be placed after GLFW window context & GLAD initializations. In other words, after
glfwMakeContextCurrent()andgladLoadGLLoader(). Note that a limitation of Tracy is that it assumes that each thread has only one rendering context. In other words, a single-threaded application does not render two or more windows at the same time. In all fairness, this is usually the case. - TracyGpuZone(“NAME ME PLZ”): As most Tracy zone macros, it marks the current scope for a specific purpose. In this case, our macro will mark all functions from within its scope as API calls that queue work on the GPU. If you have doubts about what should be included inside this zone, check the code snipped below.
- TracyGpuCollect: This macro will collect GPU the timings for the API calls located within any GPU zone. It should always be placed after swapping frame buffers. These timings will be communicated to the server and will be presented accordingly. Note that the return from glDrawArrays() let's say, does not coincide with the finalization of the GPU-bound work. That is why we need to obtain these exact timings.
/* draw points with the data stored in VAO */
glUseProgram(prog);
{
    TracyGpuZone("GPU draw");
    glUniform1f(theta_loc, 0.5f * glfwGetTime());
    glDrawArrays(GL_POINTS, 0, n);
}

/* swap front and back buffers & poll I/O events */
glfwSwapBuffers(window);
TracyGpuCollect;
glUseProgram() just specifies the shader, which is a CPU-bound operation. For this reason, it's not included in our GPU zone.
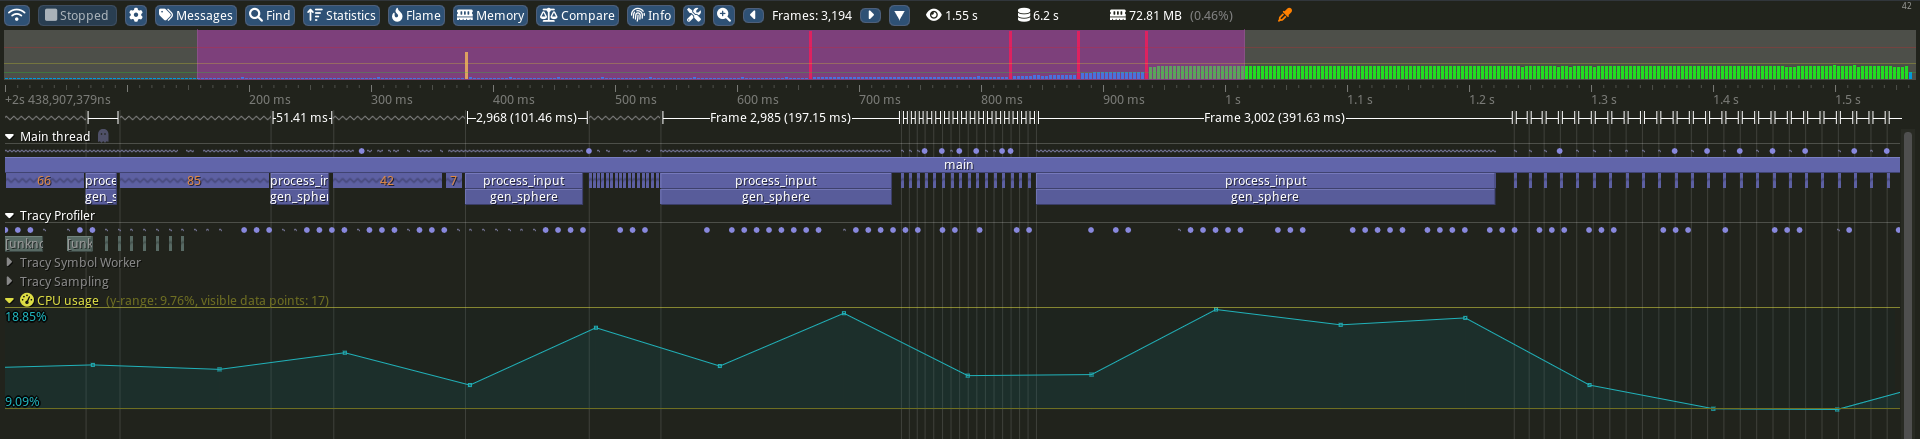
Extra task for you before you run your application again: Turn the scope of the main rendering loop into a named zone using the ZoneScopedN(“name”) macro. This should make it easier to visualize it on the Tracy server. You should obtain something along the lines of what you see in Figure 2. Notice how the duration of GPU-bound operations increased for every single draw command after regenerating the vertex coordinates. Keep in mind that we did not account for data transfers from RAM to vRAM that are triggered by glBufferData() in sphere.cpp.