Lab 5. Dedicated firewall security (part 3) - FTD
Story
Our company is still using the FTD for connecting and protecting the 2 branches (with client1 and client2) to the Internet. Also, it wants to implement the full pipeline of security policies, starting with ssl decryption (for inspecting traffic using custom CAs), then continuing with security intelligence (for blocking IPs and URLs before reaching the access rules), and in the end the access rules for IPS on balanced level, different applications to be blocked, and URL categories that have any repudiation level.
Local host prerequisites
If you have a Windows/MacOS machine, you need to install on it vnc viewer to access the Linux/Firewall machines and putty for Cisco routers/switches. You can also check this client side pack from Eve-ng for Windows and MacOS.
For Linux OS, you can use Remmina or Remote Desktop Viewer (both should be already installed). Check this link also: Remmina install.
Topology
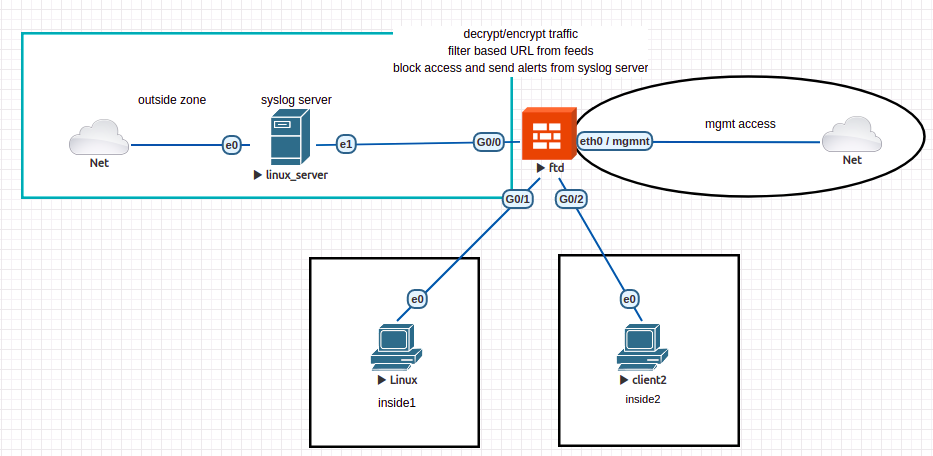
We are going to use the same topology as last time: 3 interfaces, 1 connected to outside area and 2 to internal networks (where endpoints client1 and client2 are found). You should firstly remove all policy rules, with the exception of NAT rules (for inside and inside2 zones) and access rules for permitting any traffic from inside and inside2 to outside. The rest of configured objects can be kept.
Exercises
e1. [2p] Traffic analysis
Remember the last exercise from the 3rd Cisco lab. A client sends GET requests to facebook server and traffic is blocked no matter the traffic is encrypted or not. Using Wireshark on client machine (from inside zone) try to identify how this process is done by the firewall.
e2. [5p] Send some logs
As logging is limited on our FTD device, we can use an external device for log collection. This can be a syslog server, that we will configure firstly on our linux router VM.
To configure it, do the following:
sudo apt-get update
sudo apt-get install syslog-ng
sudo mv /etc/syslog-ng/syslog-ng.conf /etc/syslog-ng/syslog-ng.conf.bkup # same the default one
sudo vim /etc/syslog-ng/syslog-ng.conf

# add here:
@version: 3.5
@include "scl.conf"
@include "`scl-root`/system/tty10.conf"
    options {
        time-reap(30);
        mark-freq(10);
        keep-hostname(yes);
        };
    source s_local { system(); internal(); };
    source s_network {
        syslog(transport(udp) port(1025));
        };
    destination d_local {
    file("/var/log/syslog-ng/messages_${HOST}"); };
    destination d_logs {
        file(
            "/var/log/syslog-ng/logs.txt"
            owner("root")
            group("root")
            perm(0777)
            ); };
    log { source(s_local); source(s_network); destination(d_logs); };

# create the log dir and restart the server
sudo mkdir /var/log/syslog-ng
sudo touch /var/log/syslog-ng/logs.txt
sudo service syslog-ng restart

# check the service if it is LISTENING on port 1025
sudo netstat -atupn | grep 1025
After this, go to another terminal on Router VM and test the syslog server:
# get the ip address of linux router VM
ifconfig eth0
# then use it below - mine was 10.3.0.84
logger -n 10.3.0.84 -P 1025 "testing my new syslog server"
And from another terminal, check the logs.txt file:
tail -f /var/log/syslog-ng/logs.txt
Nov 10 10:00:00 ubuntu eve: testing my new syslog server
Do the same thing from FTD expert mode and check with tail logs.txt:
> expert
admin@ciscoasa:~$ logger -n 10.3.0.84 -P 1025 "testing syslog from ftd"
Next, go to FDM and configure syslog for client. There are 3 important parts here:
1. create the syslog server object
2. enable logging for remote device and select severity level as informational
3. create a new access policy rule with:
- in: inside and inside2
- out: outside
- application: ICMP
- action: ALLOW
- logging: at the end of connection and send connection events to syslog server (configured at step 1). Note that all these events are informational and can also be seen locally on FTD : Monitoring > Events
e3. [3p] Teamviewer not allowed
We decided to block teamviewer application on our local networks using a new access rule. Moreover, using the syslog server configured above, we will send to the server (Linux Router VM) the connection logs when an user tries to access the website/application.
In the same time, we need a way of real time analysis of this logs (the infosec team from the company might want to see which employees are not behaving correctly and may enforce other rules for them).
After deployment, try to access the website. The access should be blocked. Instead of creating a daemon that is inspecting the logs in real time, you can use:
# configure here you access rule name (mine was named block_teamviewer)
access_rule_name='block_teamviewer'
grep "AccessControlRuleName: $access_rule_name" /var/log/syslog-ng/logs.txt | tail -n 1
to extract the latest entry in the logs file.
Then, install the mailutils in order to send an email for generating an alert - you can use your personal email address here. Send the email and check the spam folder:
mail -s "Alert teamviewer" $your_email_address <<< $(grep "AccessControlRuleName: $access_rule_name" /var/log/syslog-ng/logs.txt | tail -n 1)
In a real life scenario, we will need to analyze the logs file, parse each log, and generate an alert based on some fields (like the source user IP, website accessed, the time of accessing etc.).


