This is an old revision of the document!
Lab 6:Digital sensors
You have already used a number of sensors, which you connected to the analog pins. You will see now another type of sensor. This digital sensor provides linearized, calibrated signals in I²C format.
Accelerometer
Wiring
You can connect the accelerometer either by SPI or I2C. The easiest way will be the I2C connection. SDA and SCL pins go to the respective ones on the board, GND to Ground and VCC to 3.3V.
Streams usage
Add in Streams the visual node where you will take and return in the payload the acceleration on one of the axis.

Humidity sensor
 You can use it both for temperature and humidity.
It is, easy to connect to the board, as you see in the example.
The code
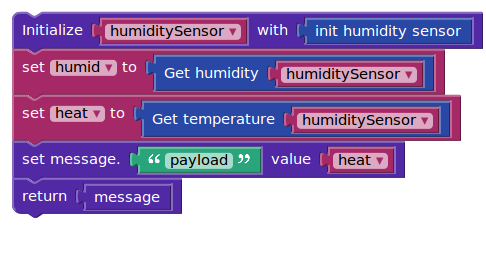
As for the code, you only need a visual node to extract the data from the sensor.

Make sure that when you go under sensors and humidity sensor and drag the initialisation block, you extract only the blue, init block. Instead of putting it inside a set block, you choose from function the initialise block. This way, the values from the sensor will be stable.
 In case you want to extract the humidity as well, you can use a change node.
Hint Double check to have the same name of the variable where the sensor was initialised and in the blocks where you take the values.
Exercises
Now, that you got friends with the sensors, you can make a variety of applications using it.
After you wired correctly and understood how the sensor works, start solving the following exercises,
- For each axis, show the value of the acceleration on the LCD
- Find the angle of inclination. You have to move the sensor on a single angle and apply the formula to find the angle.
angle=arcsin(A/g) , where A is the measured acceleration, g Earth gravity vector. - Connect an LED to the Edison. Put the sensor on the desk and hit the desk. The sensor will register the vibrations from the collision and light up the LED.
- Identify the movement frequency on one of the axis using fft .
- Show the difference of temperature between a thermistor value and the one given by the humidity sensor. Put the two on the same graphics and see the difference.
Hint you can find the function for the thermistor and the wiring in the sensors lab. - Use this graphics to apply a signal filter in a filter design software. (Matlab, Octave )
- Calculate the difference between the values of the two sensors and show it on a chart.
- Create a low pass filter with the cutoff frequency wc, using a filter design software.
- Apply this filter to the signal sent by the thermistor.


