Table of Contents
Data Logger and Graphing Terminal
- Author: Lupoi Ștefan-Alexandru
- Group: 335CA
Introduction
The project consists of a standalone data logging and visualization system based on the ESP32 microcontroller. The device reads data from analog and digital sensors (temperature/pressure, light). The data is also rendered in real time on a color TFT display. The system can be operated independently from a PC using a custom hardware interface and a standard PS/2 keyboard.
The Scope of the Project: The main scope of the project is creating a set of portable tools capable of logging and storing physical data whilst also offering the user a local control panel. The user can type commands to modify the sampling rate, graph scale, or to save/load data from memory.
Starting Idea: I wanted to build an embedded system that can integrate many communication protocols and peripherals that I studied (SPI, I2C, UART, ADC, PWM, timers, system interrupts) without using a computer. I was inspired by budget oscilloscopes.
Why It Is Useful: For regular users, the project serves as a practical and visual instrument for monitoring the environment or testing analog signals. For me as a developer, I wanted to write from scratch a driver for the PS/2 protocol (managing external interrupt timings) and coordinating multiple data buses (high-speed SPI for graphics and I2C for sensors and storing data) without blocking operations.
General Description
Block Diagram
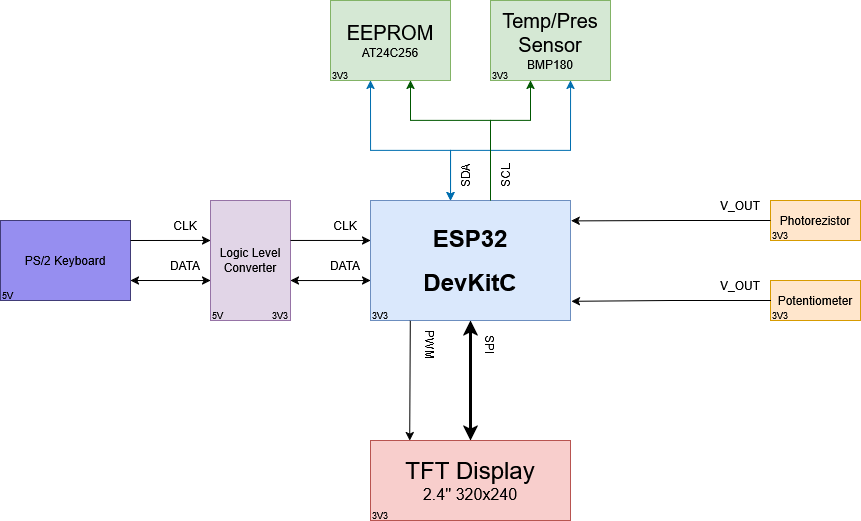
Project Modules and User-System Interaction
The system is split into hardware and software modules. The system is partially event-driven (using interrupts).
- User Input (PS/2 Keyboard and Custom Driver)
- Hardware: Signals that are coming from the keyboard (5V) go through resistors to protect the ESP32 (3.3V).
- Software: The ISR listens to the CLK pin of the keyboard and receives the data bits at every negedge cycle. The scan codes are decoded and inserted into a buffer.
- Data Reading (Sensors and Timers)
- Hardware/Software: A hardware timer dictates the reading of data from the sensors in a strict interval (ex. default = 100ms, may be changed by the user). The module reads the data from the I2C bus (BMP180) or from the ADC pins (photoresistor) and stores the values in a circular array.
- Memory (I2C EEPROM)
- When the SAVE command is issued by the user, the data is serialized and written on the I2C bus to the AT24C256 EEPROM for permanent storage.
- Graphics (SPI TFT Display)
- Using the high-speed TFT_eSPI library, the screen can render the graph smoothly. The refresh rate is optimized by drawing the “delete rectangles” ahead of the new data, thus bypassing the flickering effect. The brightness of the screen is adjustable through software using a PWM signal on the backlight (LED) pin.
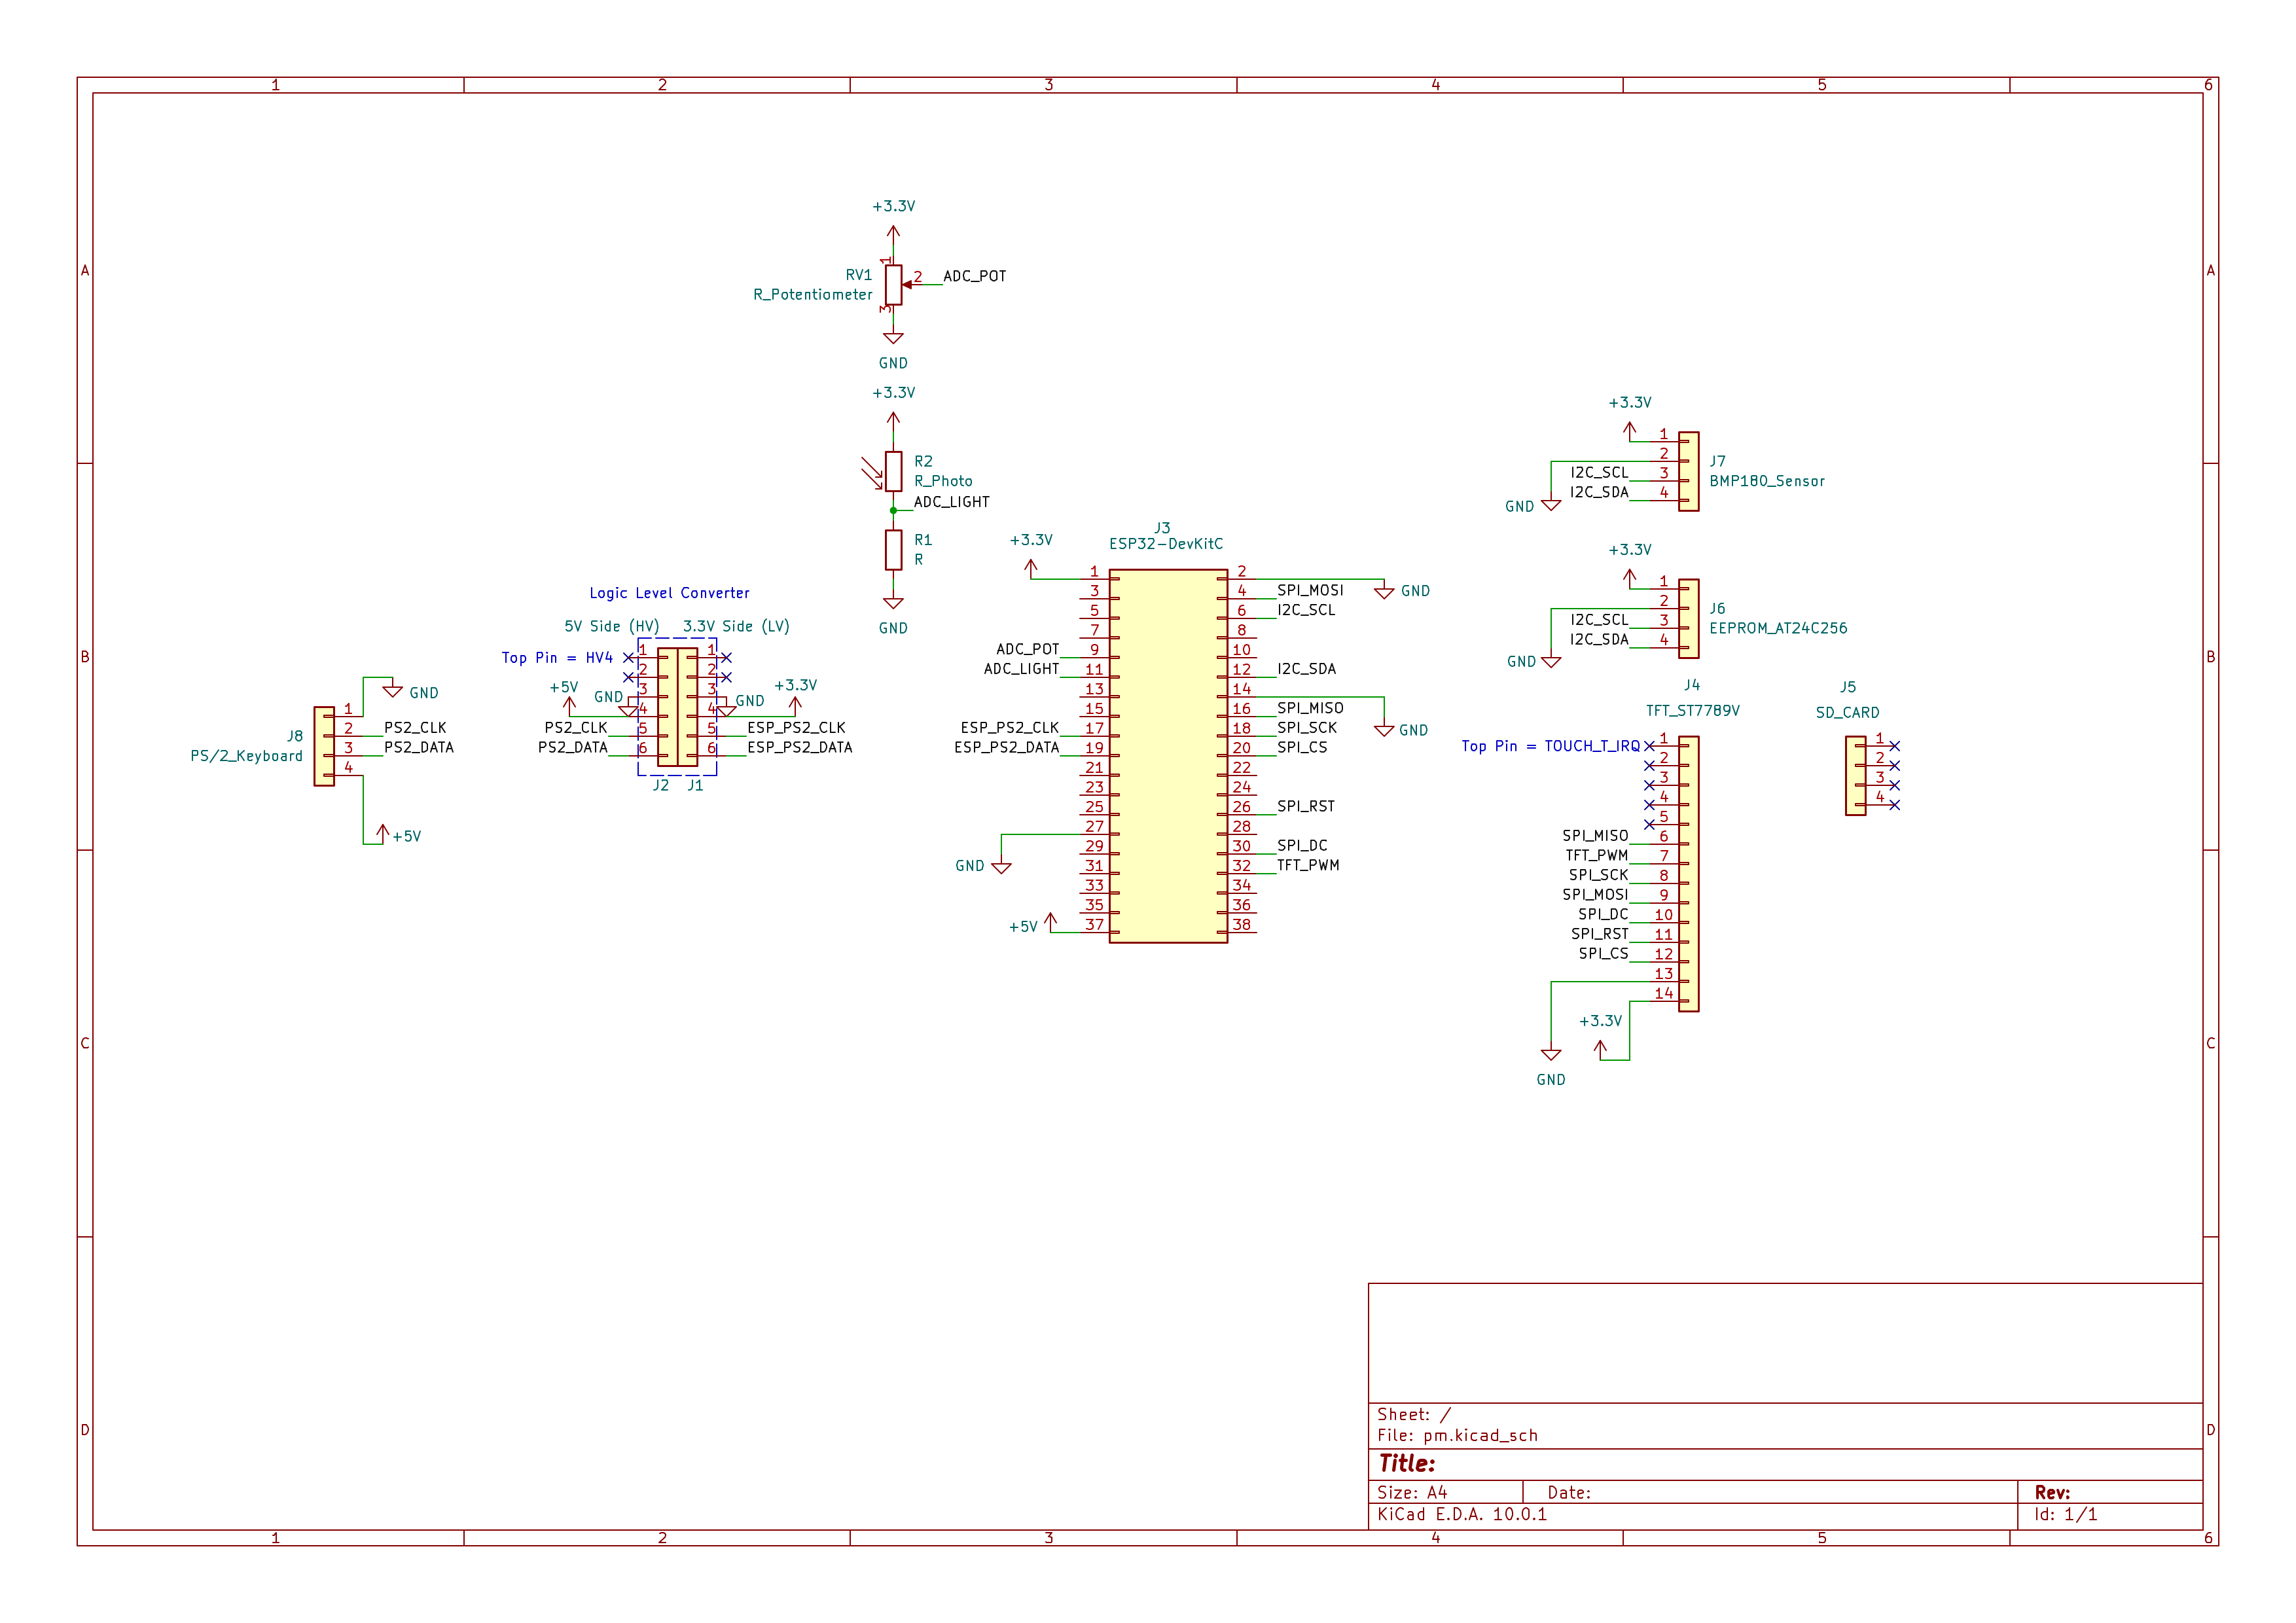
Hardware Design
Bill of Materials:
- Microcontroller: ESP32-WROOM-32D (DevKitC V4)
- Display: TFT SPI 2.4 inch display module 240×320 resolution
- Input: Standard PS/2 keyboard and female PS/2 connector (modified extension cable)
- Non-volatile Memory: EEPROM I2C AT24C256 (32K)
- Digital Sensors: BMP180 (I2C) pressure and temperature sensor
- Analog Sensors: Photoresistor (type 5528) + 10kΩ resistor (voltage divider), 10kΩ potentiometer
- Resistors: 1kΩ and 10kΩ resistors
- Transistor: BC547B NPN transistor
- Infrastructure: Breadboard and wires (female-male, male-male)
- Power: TBD
Electrical diagram
Software Design
IDE:
- PlatformIO (typically used as an extension within Visual Studio Code). The build environment is configured via
platformio.iniutilizing the Arduino framework for the ESP32 (espressif32platform).
Libraries and 3rd Party Resources:
- TFT_eSPI (by Bodmer, v2.5.43): A high-performance, hardware-accelerated graphics library specifically configured for driving the ST7789 TFT display over high-speed SPI.
- LVGL (Light and Versatile Graphics Library, v9.1.0): The core UI framework powering the graphical elements, including the interactive menus, the terminal overlay, and the real-time data charting system.
- Adafruit BMP085 Library: Used for interfacing with the BMP180 sensor over I2C to gather atmospheric pressure and temperature data.
- EEPROM / Wire (Standard ESP32 Arduino Core): Used for non-volatile storage of recorded data and managing I2C hardware communication, respectively.
- (Note: Adafruit GFX and Adafruit ST7789 libraries are included in dependencies for legacy support but superseded by TFT_eSPI/LVGL in the active application).
Algorithms and Data Structures Used (or Planned):
- Linear Data Buffer (Struct Array): A static array
data_buffer[MAX_SAMPLES]consisting of customSensorSnapshotstructs. It stores aggregated sensor payloads (timestamp, potentiometer, light, temperature, pressure). Capped at 250 samples to perfectly fit within the ESP32's 4KB EEPROM limit. - Circular Buffer (Ring Buffer): Used within the custom PS/2 keyboard driver (
_rawBuffer) to safely enqueue raw, asynchronous hardware scan codes triggered by GPIO interrupts without blocking the main thread. - State Machines:
- Keyboard Decoding: A state machine tracks modifier keys (Shift, Ctrl, Caps Lock, Extended codes) to accurately translate complex multi-byte PS/2 scan sequences into ASCII characters.
- Application Flow Control: An
AppStateenum (STATE_INITIAL,STATE_RUNNING,STATE_INSPECT) dictates the high-level system behavior, preventing invalid actions like zooming while actively recording data.
- Data Windowing and Mapping Algorithms: The graphing engine (
update_chart_source) calculates visible data slices using dynamic array indexing offsets (pan_offset) and active time windows (scale_x_window). It dynamically remaps sensor data into the display's visual space to accomplish real-time panning and zooming.
Sources and Implemented Functions:
main.cpp: The system orchestrator. Initializes the hardware peripherals, bridges LVGL with the display (my_disp_flush) and the keyboard driver (keypad_read_cb), maps keyboard shortcuts to system commands, and drives the main UI loop (lv_timer_handler).graph.cpp/graph.h: Manages the LVGL charting subsystem, data acquisition, and EEPROM state persistence.- Key functions:
init_graph(),recording_task(),update_chart_source(),cmd_start_recording(),cmd_zoom(),cmd_pan(),cmd_save(),cmd_load().
terminal.cpp/terminal.h: Implements the graphical terminal overlay and its text parser, allowing users to type and execute commands that interface with the graphing logic.- Key functions:
init_terminal_ui(),toggle_terminal().
menu.cpp/menu.h: Controls the GUI-based settings menu for intuitive user configuration using LVGL components.- Key functions:
init_menu(),toggle_menu().
ps2_keyboard.cpp/ps2_keyboard.h: A bare-metal PS/2 keyboard driver utilizing hardware interrupts to capture user inputs.- Key functions:
begin(),read(),handleInterrupt().
Rezultate Obţinute
Concluzii
Download
Jurnal
- 06.05.2026: Added introduction, general description and block and electrical diagrams.
- 19.05.2026: Added firmware, bibliography and resources. Updated electrical diagram and block diagram.