Table of Contents
Smart air quality sensor
Introduction
This project aims to implement a smart air quality sensor capable of making predictions regarding air quality for the day. The purpose of it is to give recommendations on outdoor activities based off air quality, as well as display real-time sensor data to the user. This device is of use to those wary of their health and well-being who may wish to do various outdoor activities, such as running or going for a walk around the block.
General description
The device actively polls for air quality data from its sensors and displays it on its LCD screen. It stores hourly sensor data for up to 24 hours and makes a prediction of air quality for the following day on request. The predictive analysis is accessible to the user via an HTTP server.
Hardware Design
Components
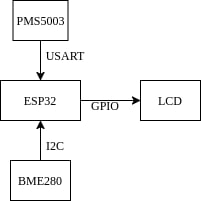
The device consists of the following hardware components:
| Component | Details | Interface | Source |
|---|---|---|---|
| ESP32 | module with integrated Wi-Fi | - | emag |
| PMS5003 | particulate matter (PM1, PM2.5, PM10) sensor | USART | emag |
| BME280 | temperature, atmospheric pressure and humidity sensor | I2C | emag |
| LCD2004 | 4×20 character display | GPIO | emag |
This choice of components was a result of various considerations pertaining to the project's specifications. The ESP32 is a powerful, dual core chip better fit for predictive analytics in contrast with its counterparts. It features on-board Wi-Fi, crucial for remotely sharing predictive data. The BME280 and PMS5003 sensors were picked for availability reasons. A large 4×20 character display was chosen over its more common 2×16 alternative to better fit all the sensor data.
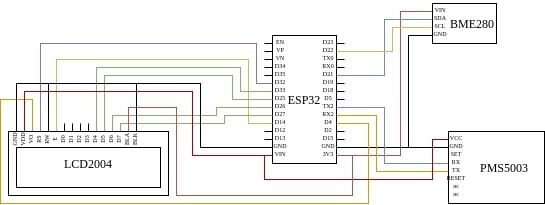
The BME280 module interfaces with the ESP32 board using its default I2C SCL and SDA pins, which need not be set in software. Its power is supplied by the board using the 3V3 pin, according to specification.
The PMS5003 sensor communicates with the ESP32 module via the serial interface. The RX and TX pins of the sensor are connected to the TX2 and RX2 pins of the module, respectively. The RX2 and TX2 pins were chosen over the RX0 and TX0 for spacial convenience. As per the specification, it is powered via the VIN pin of the ESP32 module which, while powered via USB, outputs 5V. This voltage is necessary for the sensor to function properly.
The LCD2004 display communicates with the ESP32 module via GPIO. The display can function under normal conditions while only using four data pins (D4:7). These four pins are connected to GPIO33, GPIO25, GPIO26, GPIO27, respectively for spacial convenience. The E (enable) and RS (cursor) pins of the LCD are connected to the GPIO14 and GPIO32 pins of the ESP32 module, respectively. The VO pin, which pertains to contrast control is also connected to a GPIO pin (GPIO4) which is capable of PWM. This enables contrast control from software, without the use of a potentiometer. The RW pin is pulled low via a connection to GND, which allows writing to the display. The display is powered via the VIN port of the ESP32 module, which outputs 5V while the board is powered using USB. The backlight, however, is undervolted to 3V3 (as opposed to its specified upper limit of 5V). This decision was made in consideration of power usage, despite the dimness.
Circuit diagram
Proof of work
LCD output and data readings from PMS5003 and BME280 respectively:


Software Design
The program running on the microcontroller was developed and uploaded using ESP-IDF - Espressif’s official IoT Development Framework for the ESP32. The framework provides wrappers and abstractions for various features supported by the ESP32 family of microcontrollers. These streamline development and translate focus onto actual functionality. The following abstractions were used during development:
- LED Control: peripheral library for PWM control targeted towards, but not limited to LEDs. This is used for contrast control on the LCD display, as the hardware design does not feature a potentiometer for this use case.
- Wi-Fi driver for establishing wireless connections to send predictive data over. Additionally, the event handling library was used to gracefully handle connection establishment.
- UART library for interfacing with the PMS5003 particulate matter sensor. The driver for this sensor is self-written, in accordance with its datasheet. The payload regularly sent by the sensor consists of 32 bytes - 2 start bytes (0x42 and 0x4D), 2 bytes for the data length (0x00 and 0x1C if not tructated), 26 bytes of measured data and 2 last bytes for the payload's checksum. Of these, only bytes 10 through 15 are of use, covering PM2.5 and PM10 readings.
- HTTP Server implementation, which responds to GET requests with predictive AQI data for the next hour.
Aside from the libraries available inside ESP-IDF, the following third-party libraries were used for peripheral communication:
- BME280 I2C driver easily integrated into the project via the ESP Component Registry. It streamlines use of I2C and BME280 sensor readings.
- HD44780 driver plucked from its parent library. This controller is compatible with various character display controllers, including the one present in the LCD2004.
Predictions of AQI are made using a highly accurate regression model trained and deployed using the Edge Impulse platform. Edge Impulse provides tools and APIs for training and deploying machine learning models specifically on edge devices, including embedded systems. The model was trained on two years' worth of hourly readings of PM2.5 and PM10, starting from 2023 and ending in 2024. The readings were translated into an AQI following this US Environmental Protection Agency paper. The dataset was split into samples covering 24 hours, each labled as the AQI reading of hour 25. The readings are publicly available on www.calitateaer.ro.
All the previous components interact as follows:
- A connection is established via Wi-Fi and the HTTP server is started.
- The two sensors are the LCD are initialized.
- The device waits for 30 seconds, while the PMS5003 sensor warms up (in accordance with its specifications)
- Every minute, data is read from the sensors and displayed on the LCD. The BME280 should be read at least every 60 seconds, according to its specification.
- Every hour, the data read from the PMS5003 sensor is turned into an AQI and saved in a buffer of size 24.
- Upon receiving a GET request, the HTTP server responds with the AQI for the following 24 hours predicted using the regression model uploaded onto the microcontroller. The device should ideally run for at least 24 hours before a prediction is requested, so 24 hours of predictive data may be available in the buffer.
Results
A demonstration of the device is available at https://youtu.be/Bxe3qhWADMU.
Conclusions
Download
The software implementation is available at https://github.com/Cosminovici22/pm_project.
Journal
- 13th to 16th of May: arrival of components
- 17th and 18th of May: assembly of device components
- 23th to 25th of May: development of device software
- 28th and 29th of May: refinement and packaging of device
- 30th of May: device demonstration at PM fair