Table of Contents
Solar Tracker
Introduction
Short description of your project:
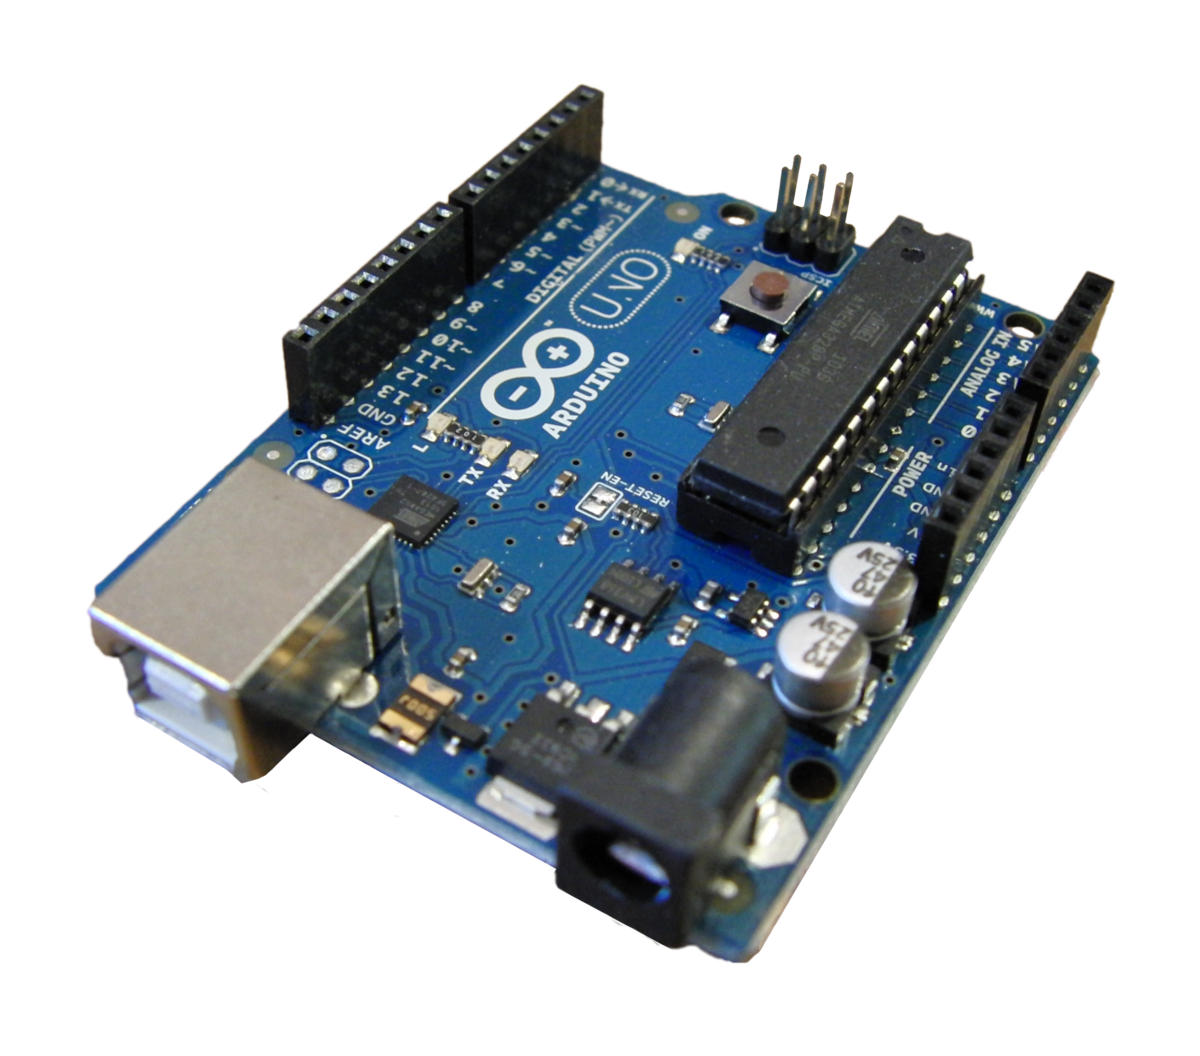
The prototype is built on a dual-axis solar tracker that is managed by an Arduino Uno, an open-source prototyping platform with user-friendly hardware and software. Light-dependent resistor (LDR) sensors can be used to automatically control the solar tracker, or a potentiometer can be used to manually control it. Additionally, this test bench offers Excel-based virtual instrumentation that allows users to collect and display data from their solar trackers. The intended test bench is made to help students in better grasping control theory and its applications.
- Being very interested in solar panels, initially, I thought that I would like to make a system in which a solar panel would spin after the sunlight, but I would also like to make a statistic on its efficiency and consumption. So I looked for a program that would connect to this system from which it takes data and do with it a statistic.
General description
![]()
Hardware Design
Parts used:
- Resistor 330 ohm

- Arduino UNO
- Rotary Potentiometer - 10k Ohm

- BreadBoard

- Pushbutton

- SG90 Micro-servo motor
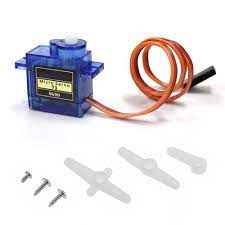
- MG996 Micro-servo motor

- LDR-5528

- Mini Solar Panel-1W, 5V

Hardware schema

Electric schema

In reality, it looks like this ![]() :
:

I also have a video that shows exactly how it works: https://youtube.com/shorts/aRd-pFQhVII?feature=share
Software Design
The software will be built into the hardware (Arduino Uno) so that it can be used to control and watch the solar tracker. The program that is built in is made to meet the following needs:
- There are two ways to use the test bench: manually and automatically. To switch between the two states, a push button is wired to pin 12.
- If the manual mode is on, the potentiometer can direct the servomotors from east to west for the left-right motor or from south to north for the up-down motor. Pin 11 is linked to a push button that lets you choose which of the two motors the potentiometer controls. It can either control the left-right servomotor or the up-down servomotor.
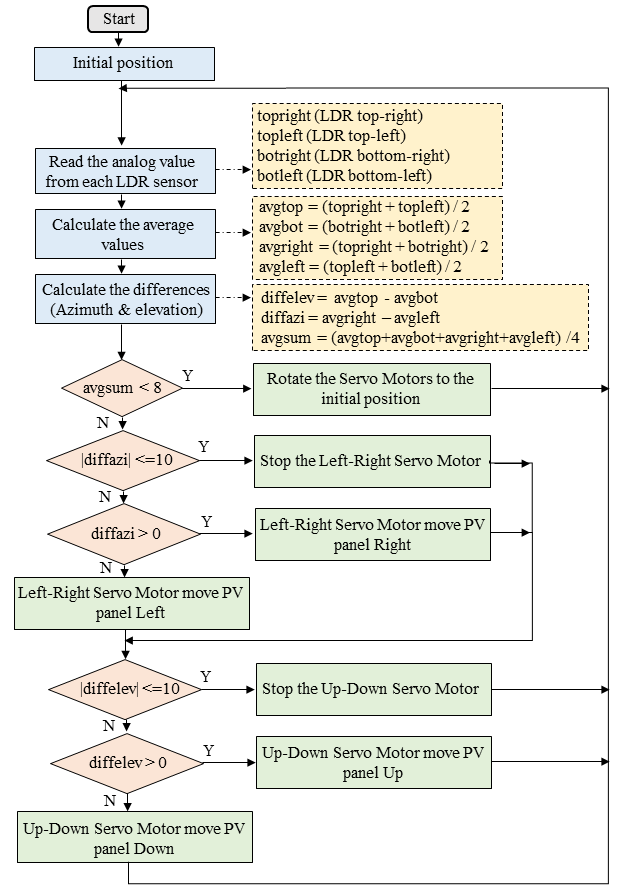
- The method that is presented in the next figure will run in automatic mode. It employs LDR sensor analog values. For vertical axis, the average readings from two right LDRs and two left LDRs are compared, and if the left set receives more light, the left-right servomotor moves the solar tracker. The latter rotates until the difference result is [−10, 10]. This range stabilizes the controller, and once the solar tracker is perpendicular to the sun, control stops. However, if the right LDRs receive more light, the solar tracker moves in that direction through the left-right servomotor and continues to spin until the difference result is in the range [−10, 10]. Elevation axis works similarly. We also calculated the average radiation from the four LDR sensors and whether it is less than a small value. It's night time, in this instance, the solar tracker must return to sunrise. If the sun rises at 0 degrees in the left-right servomotor and 30 degrees in the up-down, set them accordingly. The Arduino IDE C function “servox. write(angle)” makes this easy.
- It is necessary to process and use the PV voltage measured by analog pin A5 to calculate the PV current and power. Then, the data and the real mode must be sent to the computer via USB cable and shown in Microsoft Excel.
Obtained results
Data can be sent from an Arduino microcontroller to an Excel spreadsheet with the help of the PLX-DAQ Excel Macro. All that has to be done is downloaded. A “PLX-DAQ” folder, containing a “PLX-DAQ Spreadsheet” shortcut, will be created on the PC after installation. Then, to get the board talking to Excel, we open Excel and specify the connection parameters (Baud rate and port) in the PLX-DAQ window. Clicking “connect” then causes the Excel sheet to update in real time with the output data.

Concluzii
Download
Fişierele se încarcă pe wiki folosind facilitatea Add Images or other files. Namespace-ul în care se încarcă fişierele este de tipul :pm:prj20??:c? sau :pm:prj20??:c?:nume_student (dacă este cazul). Exemplu: Dumitru Alin, 331CC → :pm:prj2009:cc:dumitru_alin.
Jurnal
11.05.2023-I did the hardware design part at the lab
17.05.2023-I wrote the second part of the project (hardware design)
26.05.2023-I wrote the third part of the project (software design)
Bibliografie/Resurse
- Documentation in pdf format: solar_tracker.pdf
- All the files that the project has: solar_tracker.rar