1. Data collection system
Hardware
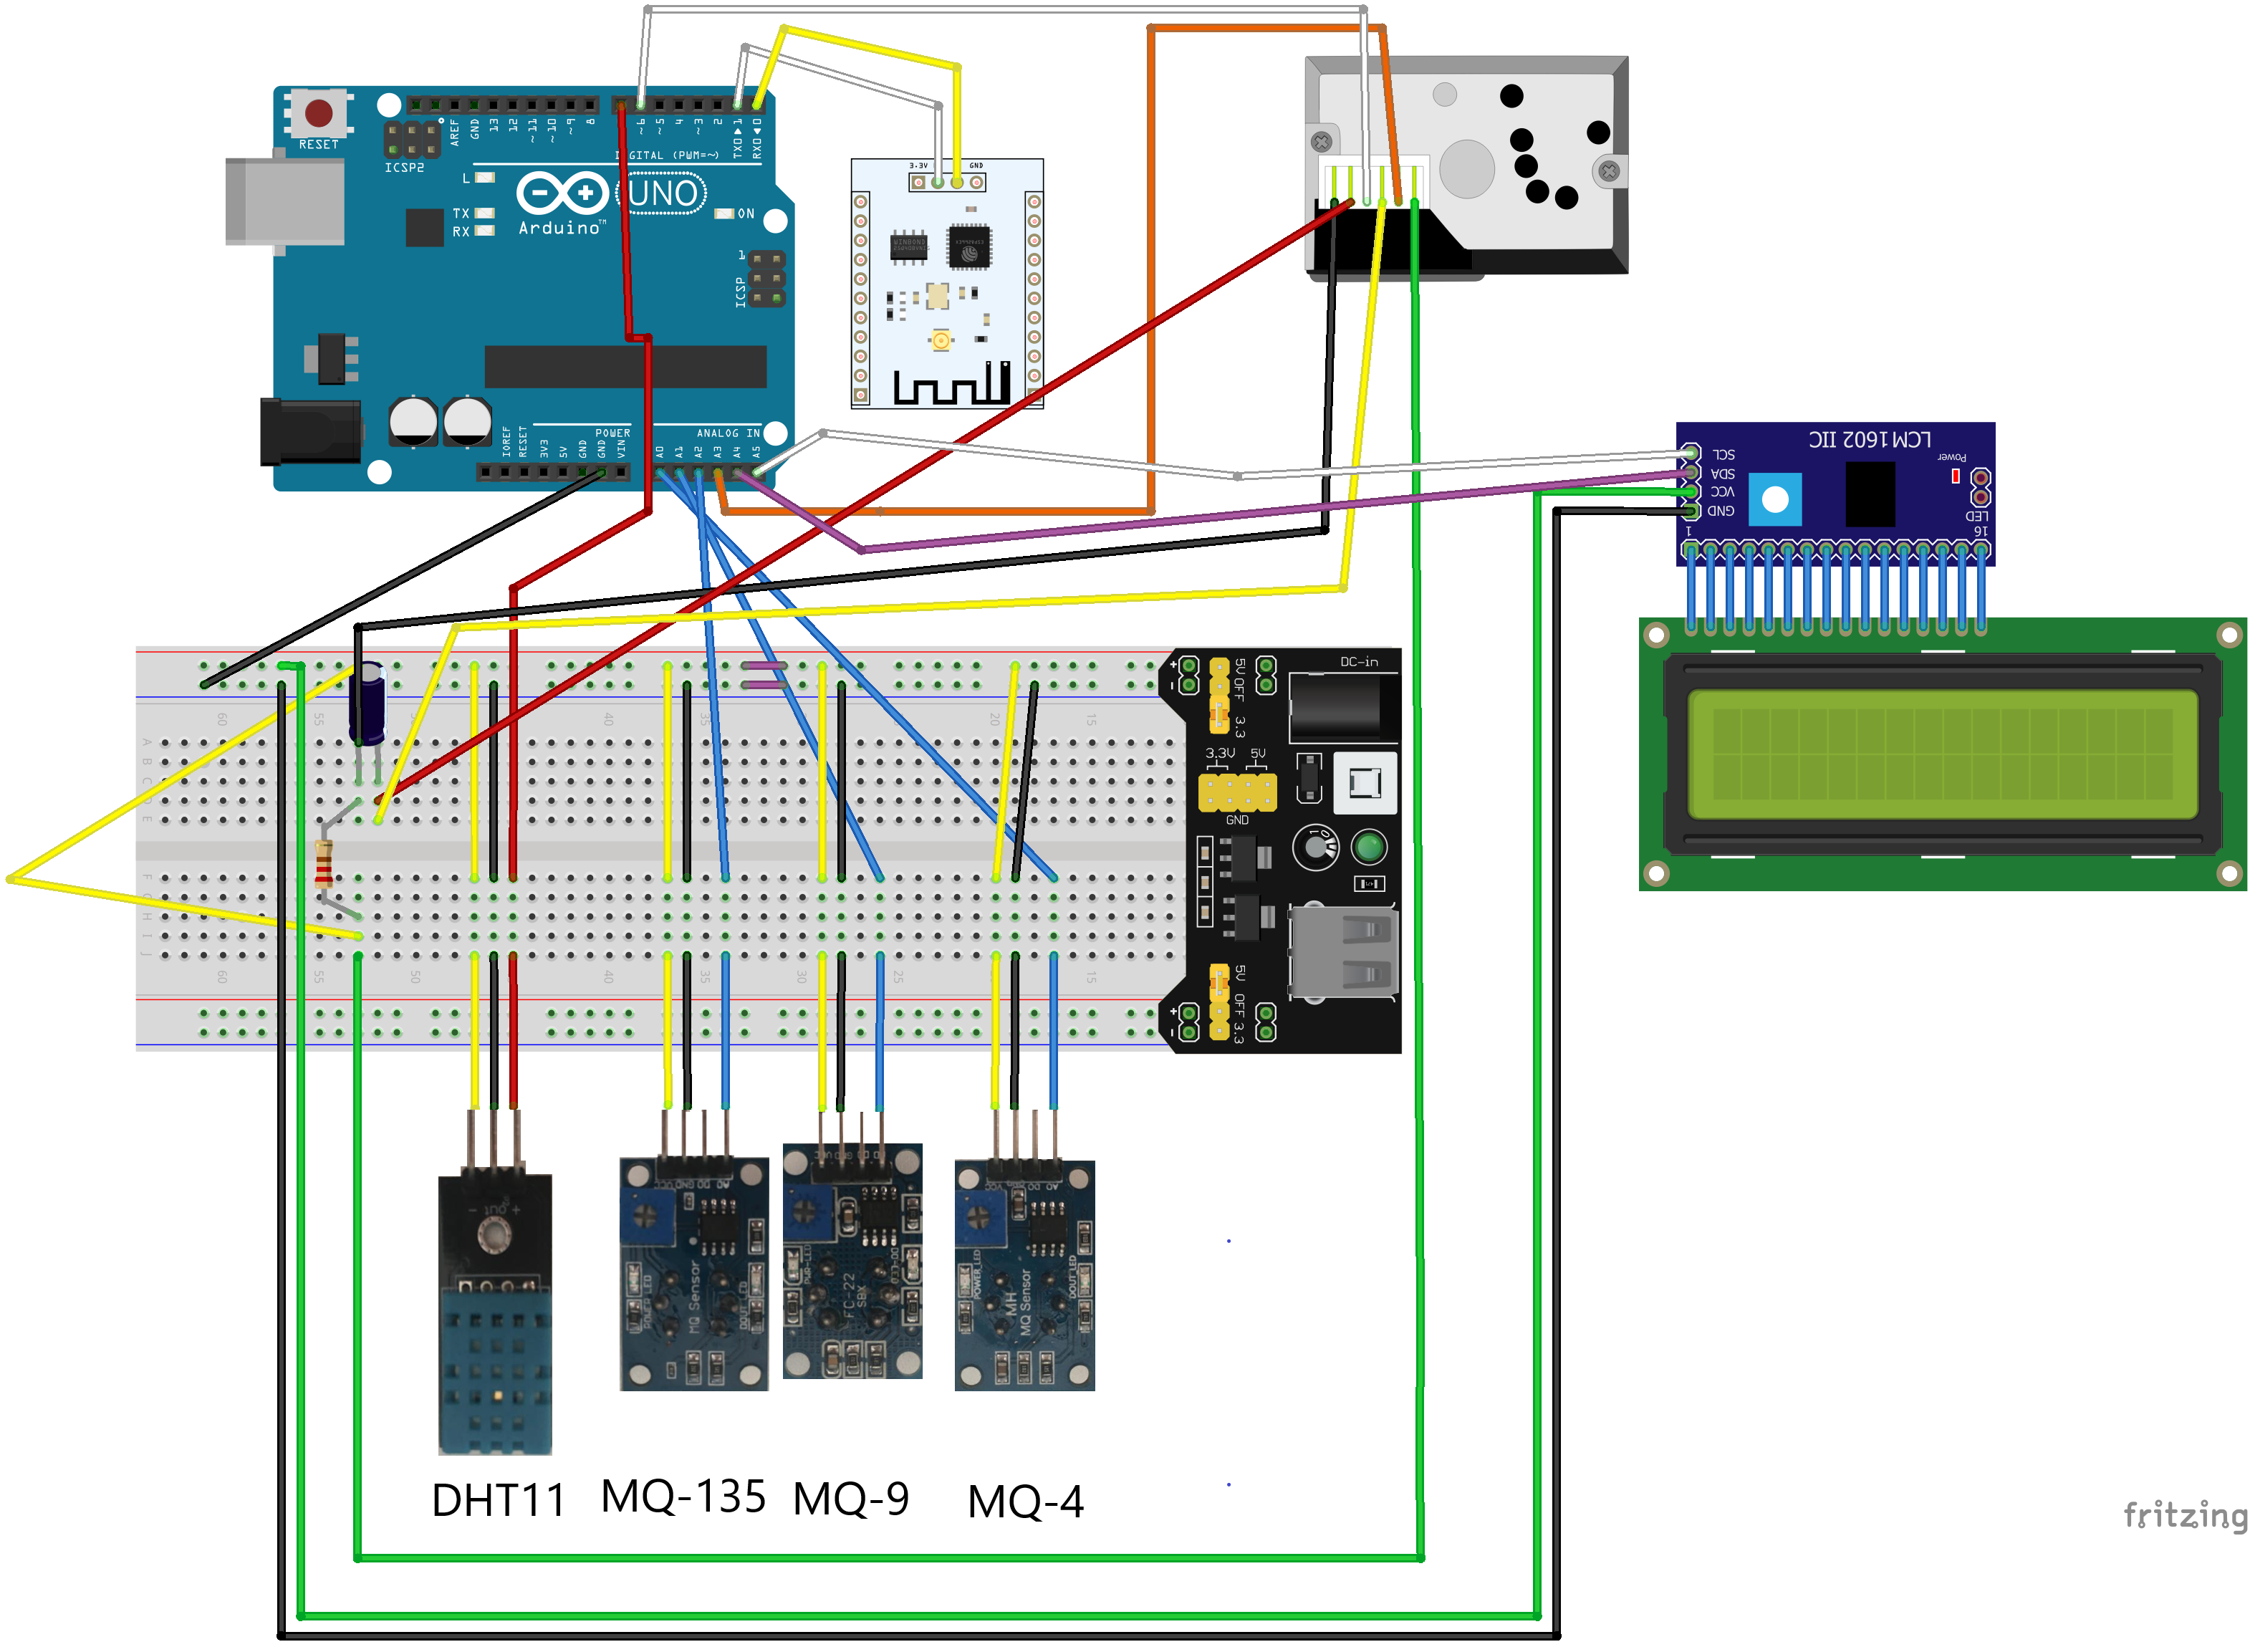
The electronic system used for data collection consists of the following components:
- UNO R3 development board with Arduino compatible ESP 8266 WiFi module
- External battery pack POWERZILLA PZ 11000, 11000 mAh.
- Breadboard MB102 + 3.3V and 5V Power Source
- Sensors
- MQ-4 Gas sensor - used for detecting natural gas and methane
- MQ-9 Gas sensor - used for detecting carbon monoxide
- MQ-135 Air Quality sensor - used for determining air quality
- Optical particle GP2Y1014AU0F sensor - used to determine the concentration of dust particles in the atmosphere on the basis of which the parameter of interest PM2.5 was established
- Connecting wires
- Dupont wires - used to connect the development board and sensors
- USB-A to micro USB-B cable male/male - used to power the development board from the external battery
- USB-A to USB-A cable male/male - used to power the breadboard from the external battery
- LCD1602 screen - electronic display with two lines of 16 characters each
- I2C LCD 1602 interface module - the module used to reduce the number of pins on the development board which are needed to be connected to the LCD1602 screen. This way it only occupies the A4 and A5 pins corresponding to the SDA and SCL signals in the I2C transfer protocol respectively.
Software
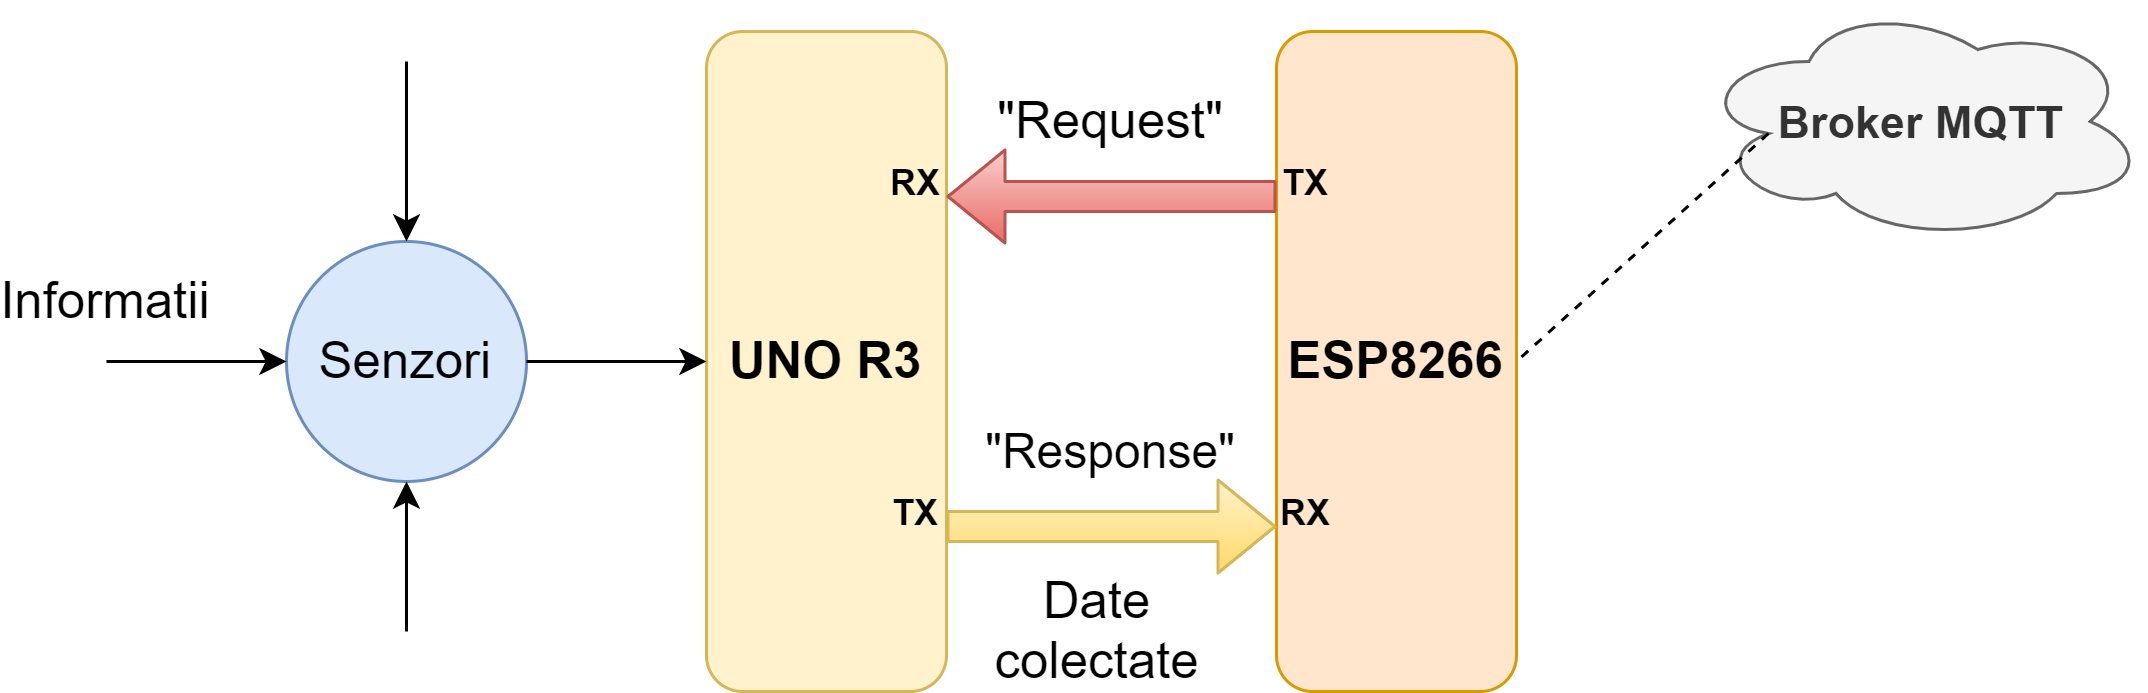
The UNO R3 compatible module is programmed to wait periodically to receive a Request command from the ESP module. Once the command is received, the module reads the data transmitted in serial format by the connected sensors, and sends them a Response command in JSON format to the ESP module.
The ESP8266 module is programmed to connect to a Wi-Fi network at startup, and then to connect to the MQTT broker: broker.mqtt-dashboard.com.
After the initial connections, the module will periodically send Request messages to the UNO R3 module, in order to receive from it the data taken by the sensors. The received data are then published in a predetermined MQTT topic, from which they will be taken later by another component of the IoT system.
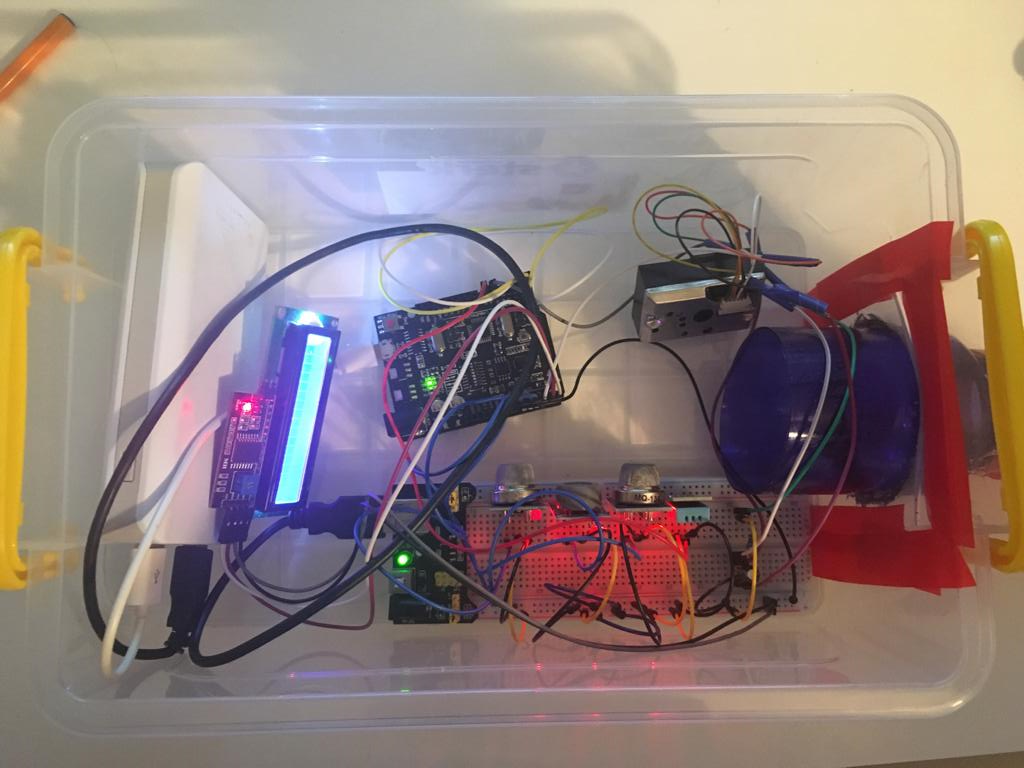
Encapsulation
The purpose of this work for later use is in a geographically distributed network of sensors, and a possible implementation is for the network to be made up of a number of drones, each equipped with a measuring system.
Therefore it was considered necessary to provide a method of encapsulating the system in a hermetically and thermally insulated enclosure. However, airtight and thermal insulation is also indicated in the usual use of the system, primarily due to the fact that the system contains fragile components, which makes it vulnerable to shocks. and the electrical nature of the structure makes it susceptible to atmospheric phenomena or even human accidents. Second, it is desirable that the measurements made by the system be as accurate as possible, despite the impossibility of ensuring laboratory conditions in which all components can be calibrated and operate at optimum parameters. Each component that makes up the system, and especially the sensors, offers different performance depending on the ambient temperature, in the case of sensors, the laws of measurement differ drastically.
Thus, the encapsulation of the system ensures a controlled environment of the measure, reducing as much as possible the disturbed and external effects. 4 liters. The dimensions of the box are 31x19x12, being represented in centimeters. The box is resistant to a range of temperatures between 25 ° C and 95 ° C, sufficient temperatures to ensure the safety of the system in the environment to be measured.
2. Data transfer and processing
MQTT Broker
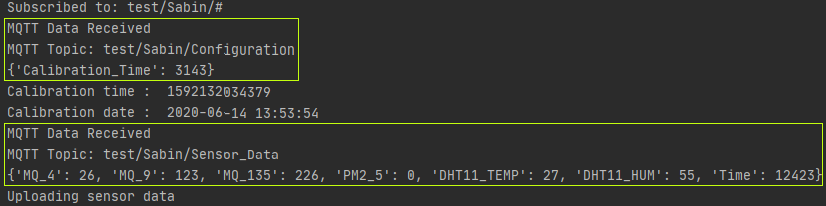
A public MQTT broker is used to retrieve the data collected by the electronic data collection system: broker.mqtt-dashboard.com. In it I published the ESP8266 module messages in the test/Sabin topic, using the test/Sabin/Sensor_Data and the test/Sabin/Configuration subtopics.
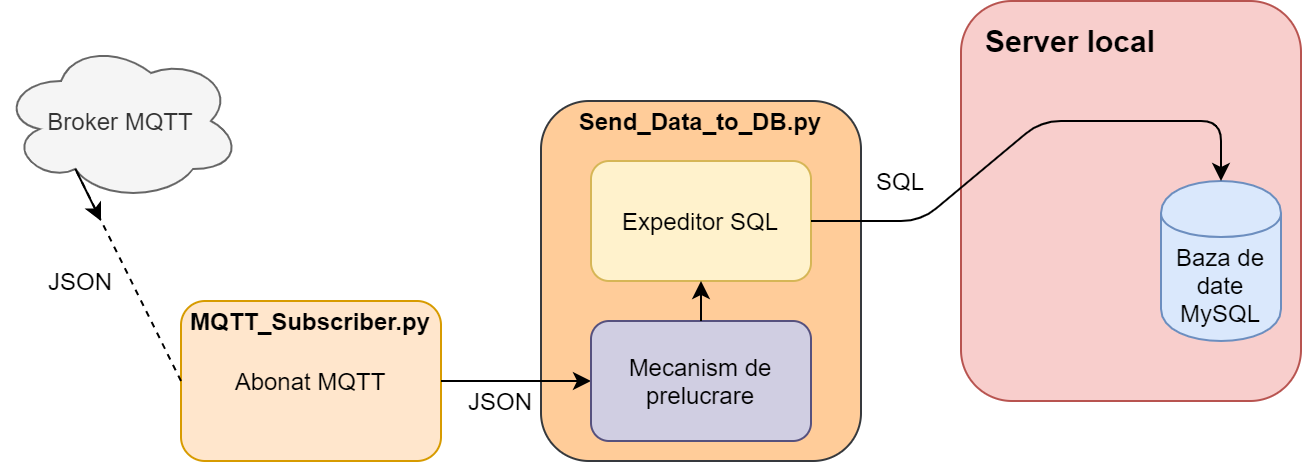
Data Transfer Engine
The data transfer mechanism is built in the Python programming language and consists of two main components.
The first component is a subscriber to the whole test/Sabin topic so it will receive messages from any of its subtopics. When a message in the test/Sabin/Configuration subtopic is received, this will update the variable containing the calibration time. This calibration time is necessary because the development board transmits the start-up time, which is added to the calibration time to obtain the exact time at which the measurements were executed. When a message in the test/Sabin/Sensor_Data subtopic is received, it will transmit the data to the second software component.
The second software component is a mechanism for processing data, building and sending SQL commands. Based on the data read by the sensors, received from the MQTT subscriber, the component extracts the measured concentrations following the methodology. It then builds SQL commands to insert this information into the MySQL database.
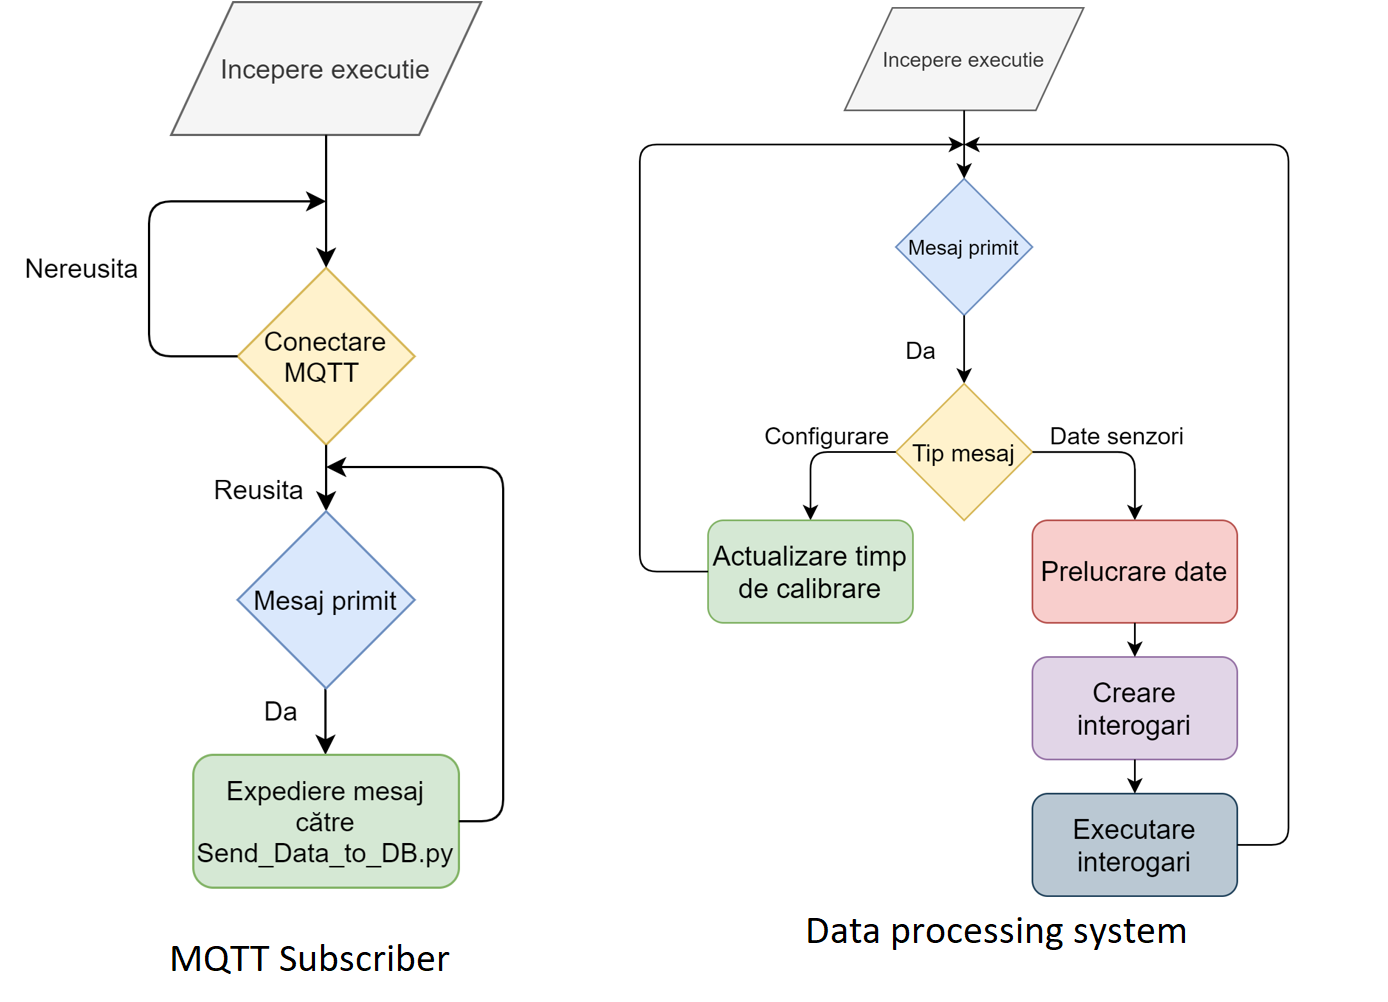
The entire flow is:
3. Web Application for visualizing data
In this paper, a Web application was created for visualizing data, starting from an open source template that provides examples of creating different graphical interface elements within the application. The table elements were created using the DataTables software opensource licensed under the MIT license, and graphics were created using the Chart.js software as well as the open source MIT license.
The web application is designed to be used by three types of users, for whom different types of applications have been created.
- Typical user - The type of user who can view the air quality information processed and receive statistics and announcements. A user can also access theoretical information on air quality and measurement methodology used in the project and, if necessary, can submit requests for technical assistance.
- Observer - The type of user who can access the data taken by the sensor in raw information, also receives statistics and announcements, and can publish in turn or an announcement. In addition, the observer can access information of a theoretical nature. Depending on the air quality and the measurement methodology used in the project, it may, if necessary, submit requests for technical assistance.
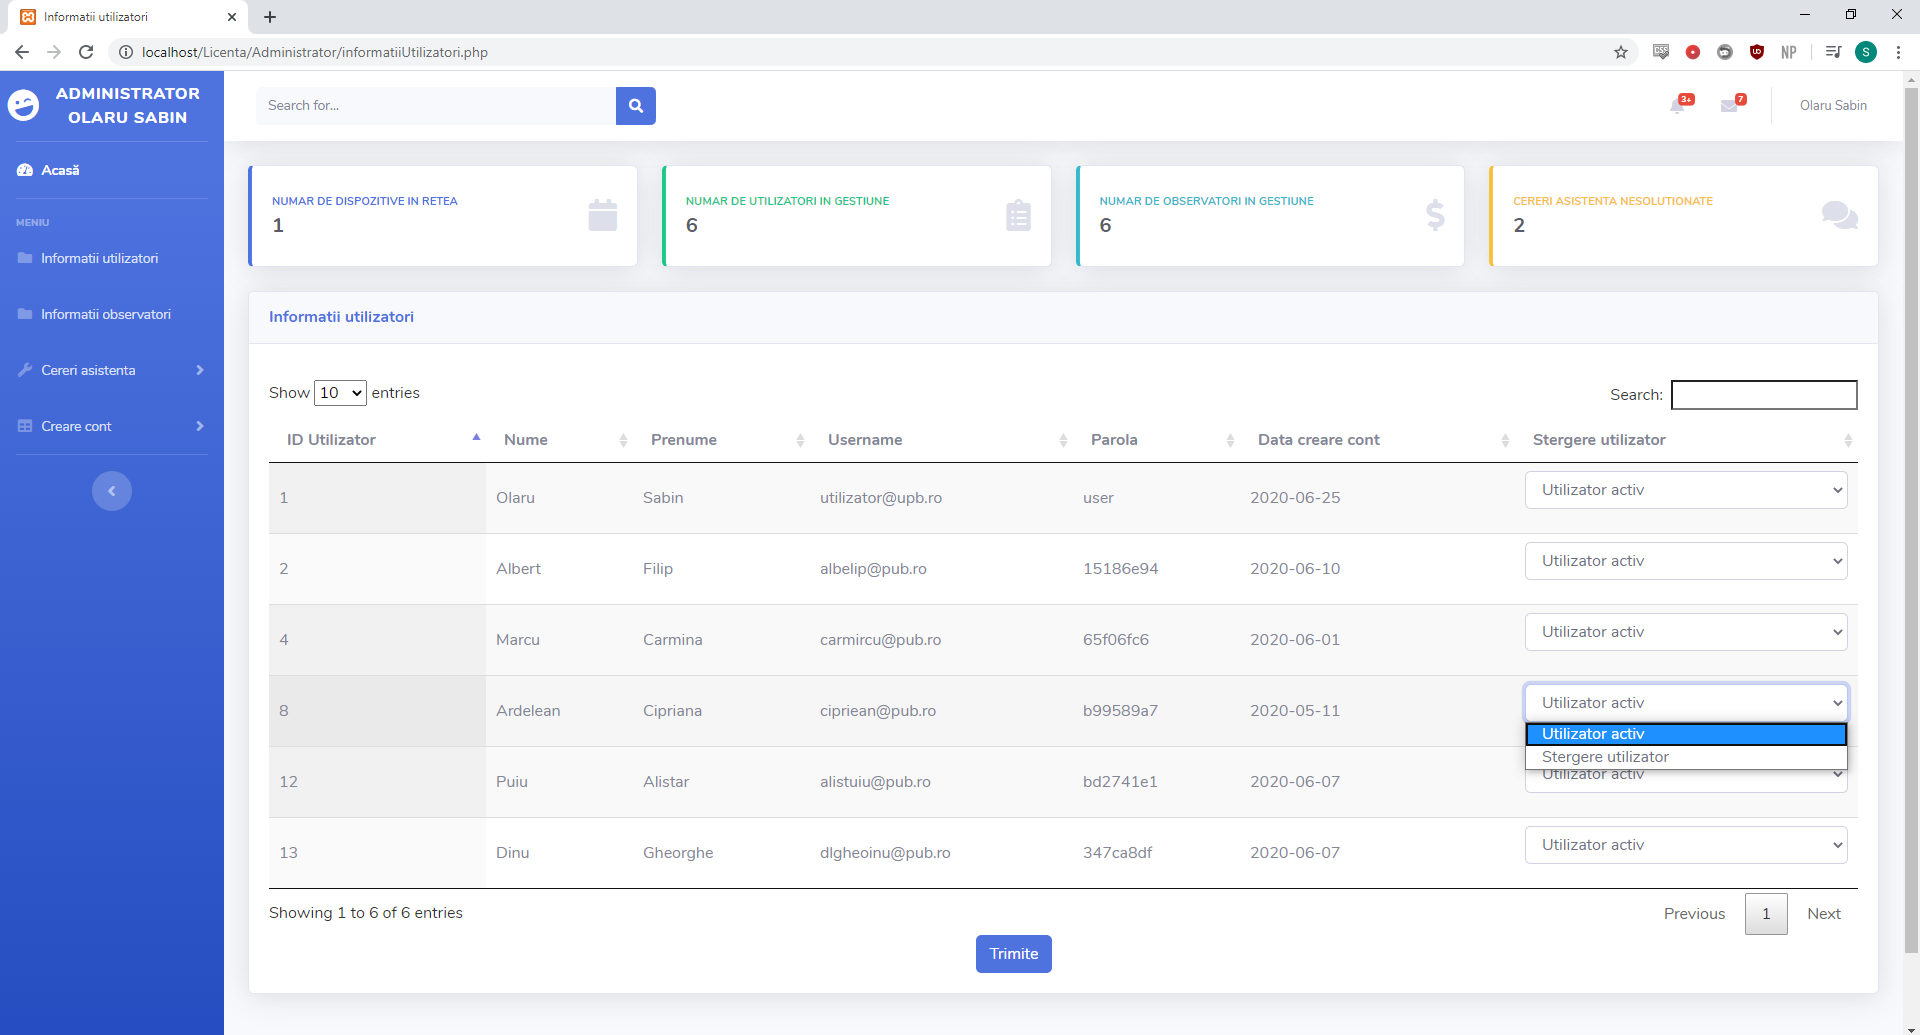
- Administrator - A type of user whose purpose is to administer the created platform, who can view information about regular users and observers. you need to fix them and add or delete users.
In the following, several snapshots from the application will be listed:
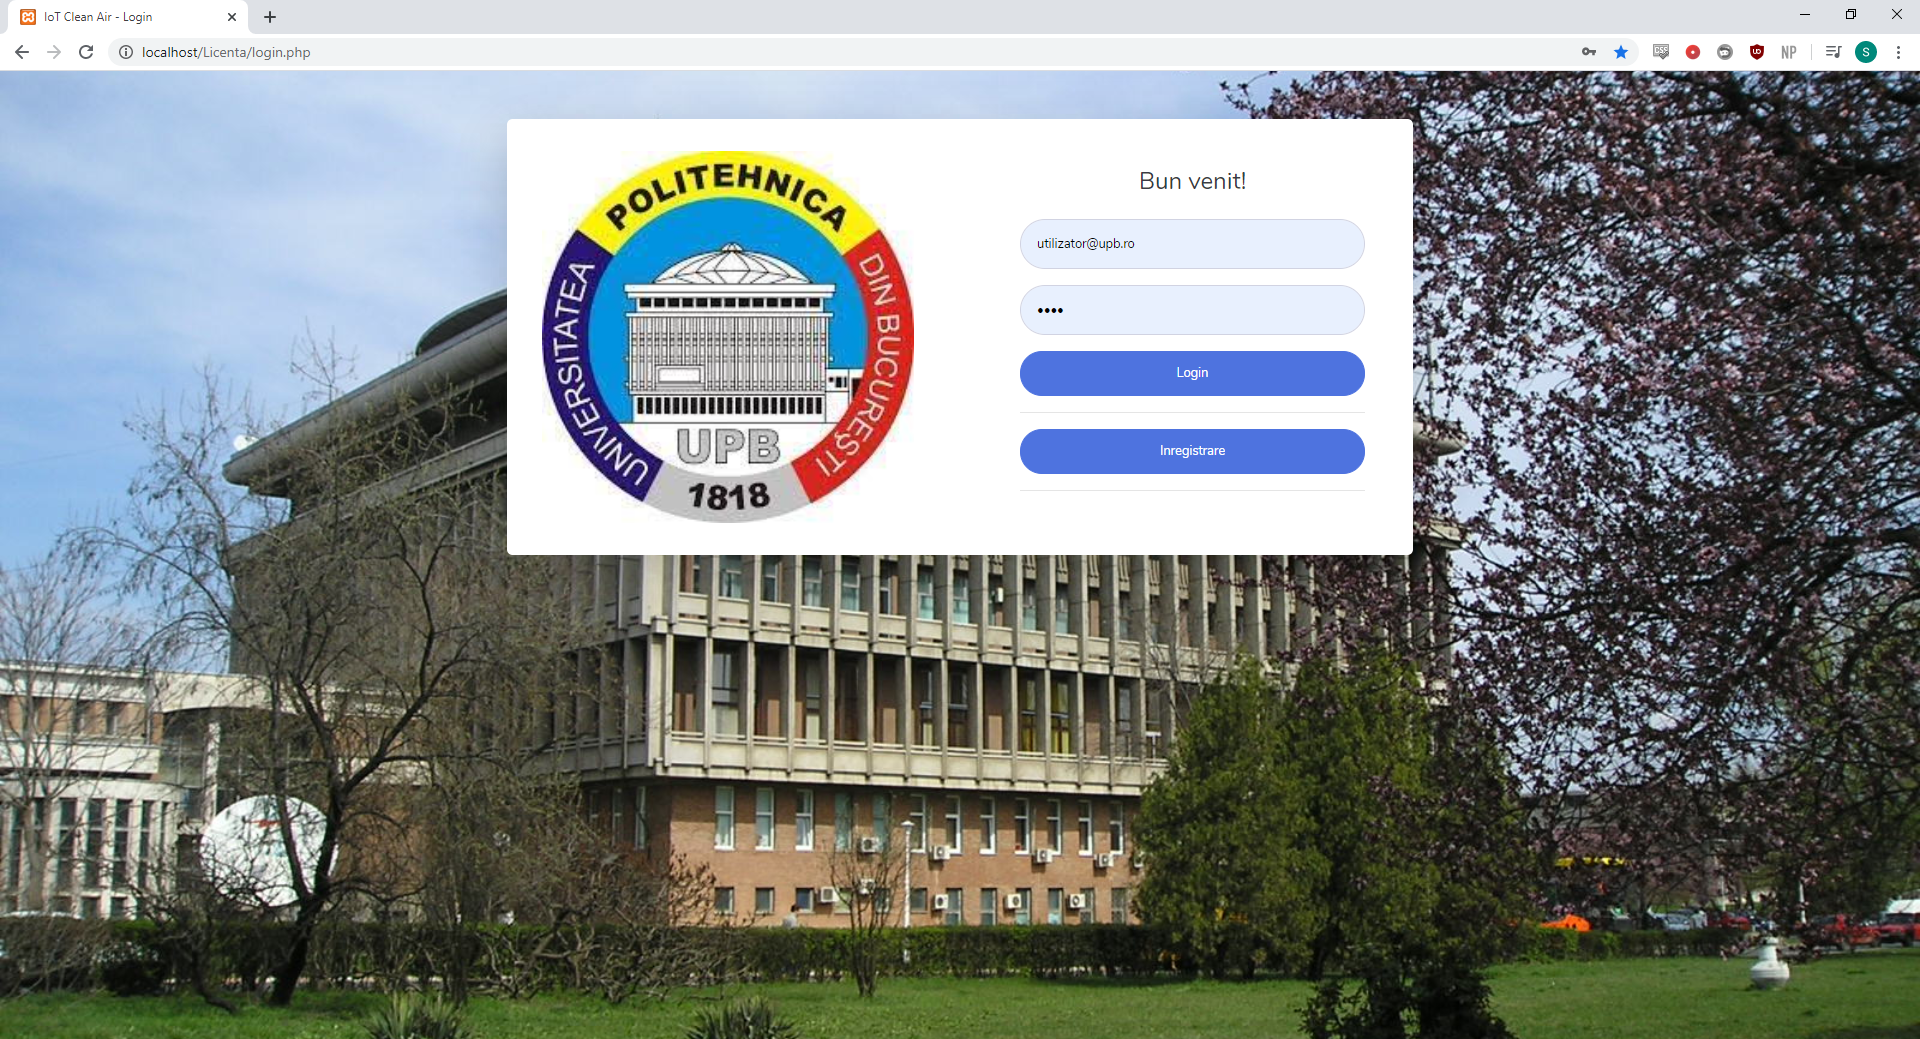
Login Page:
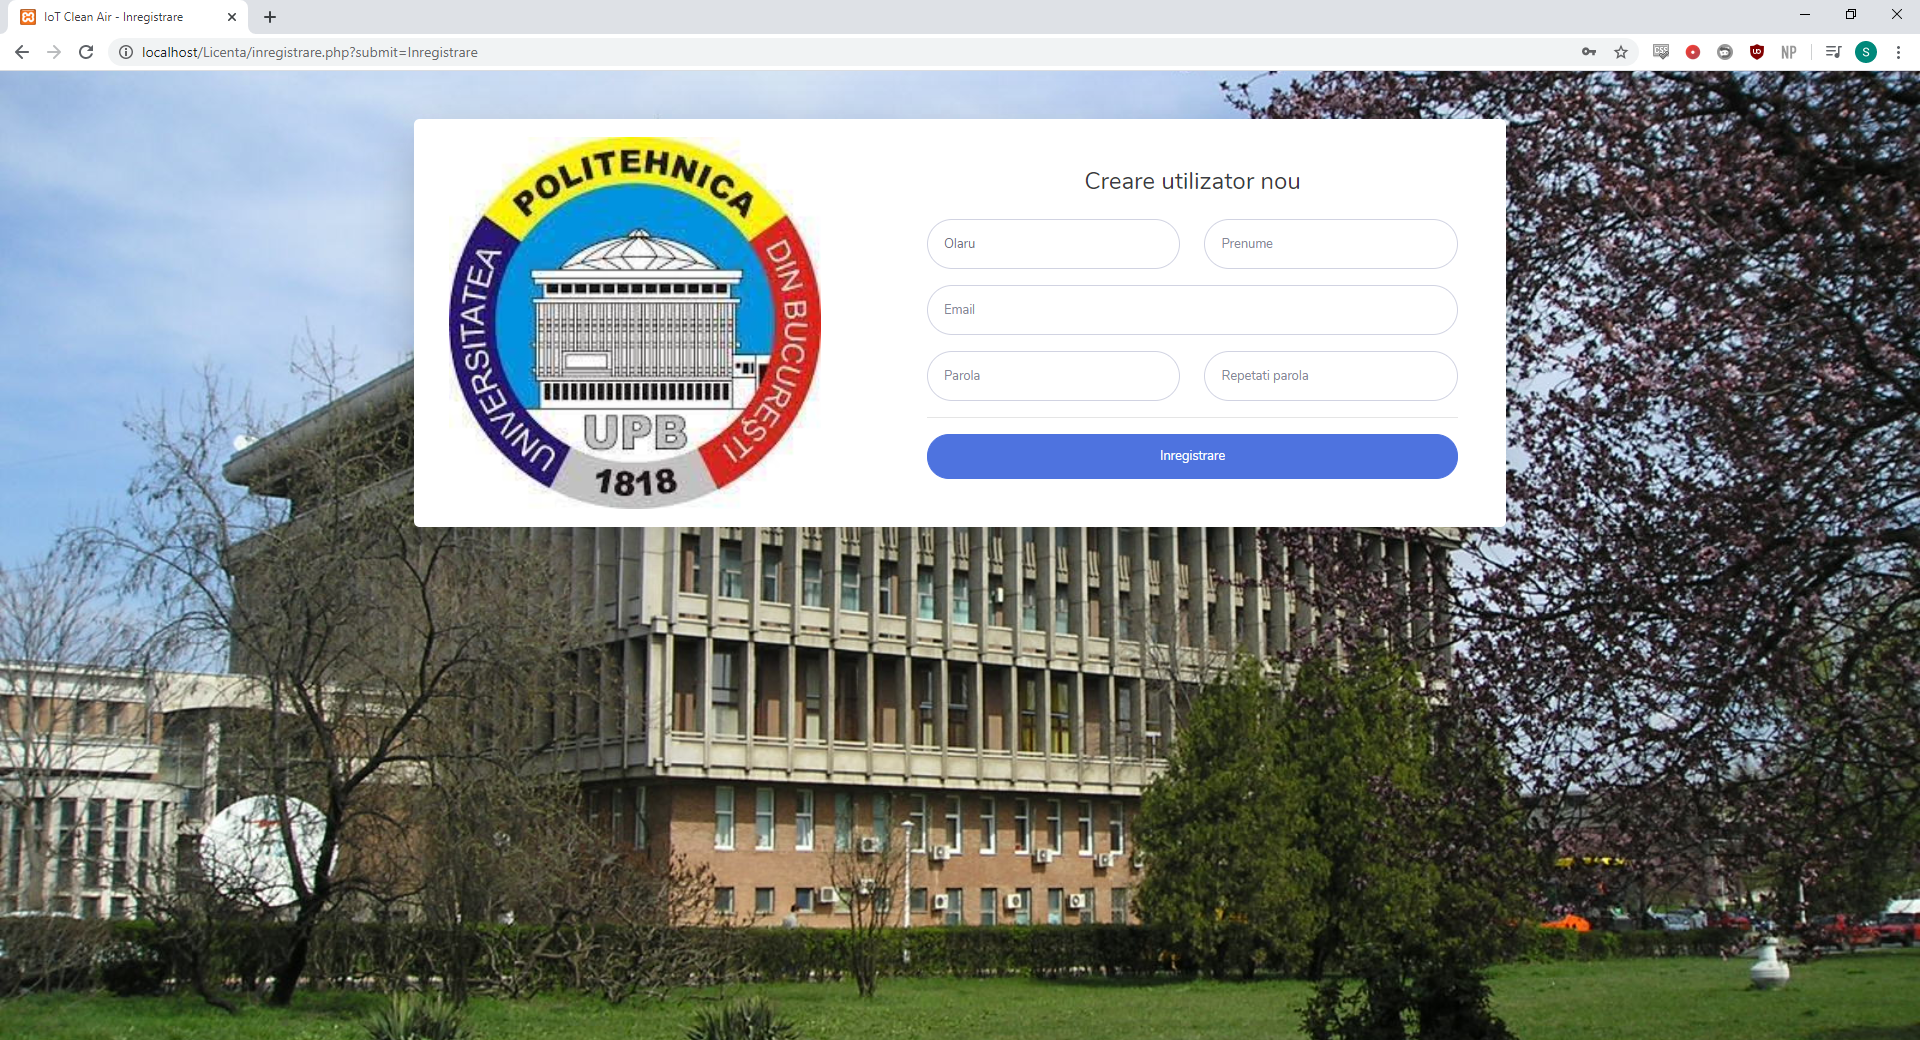
 Register Page:
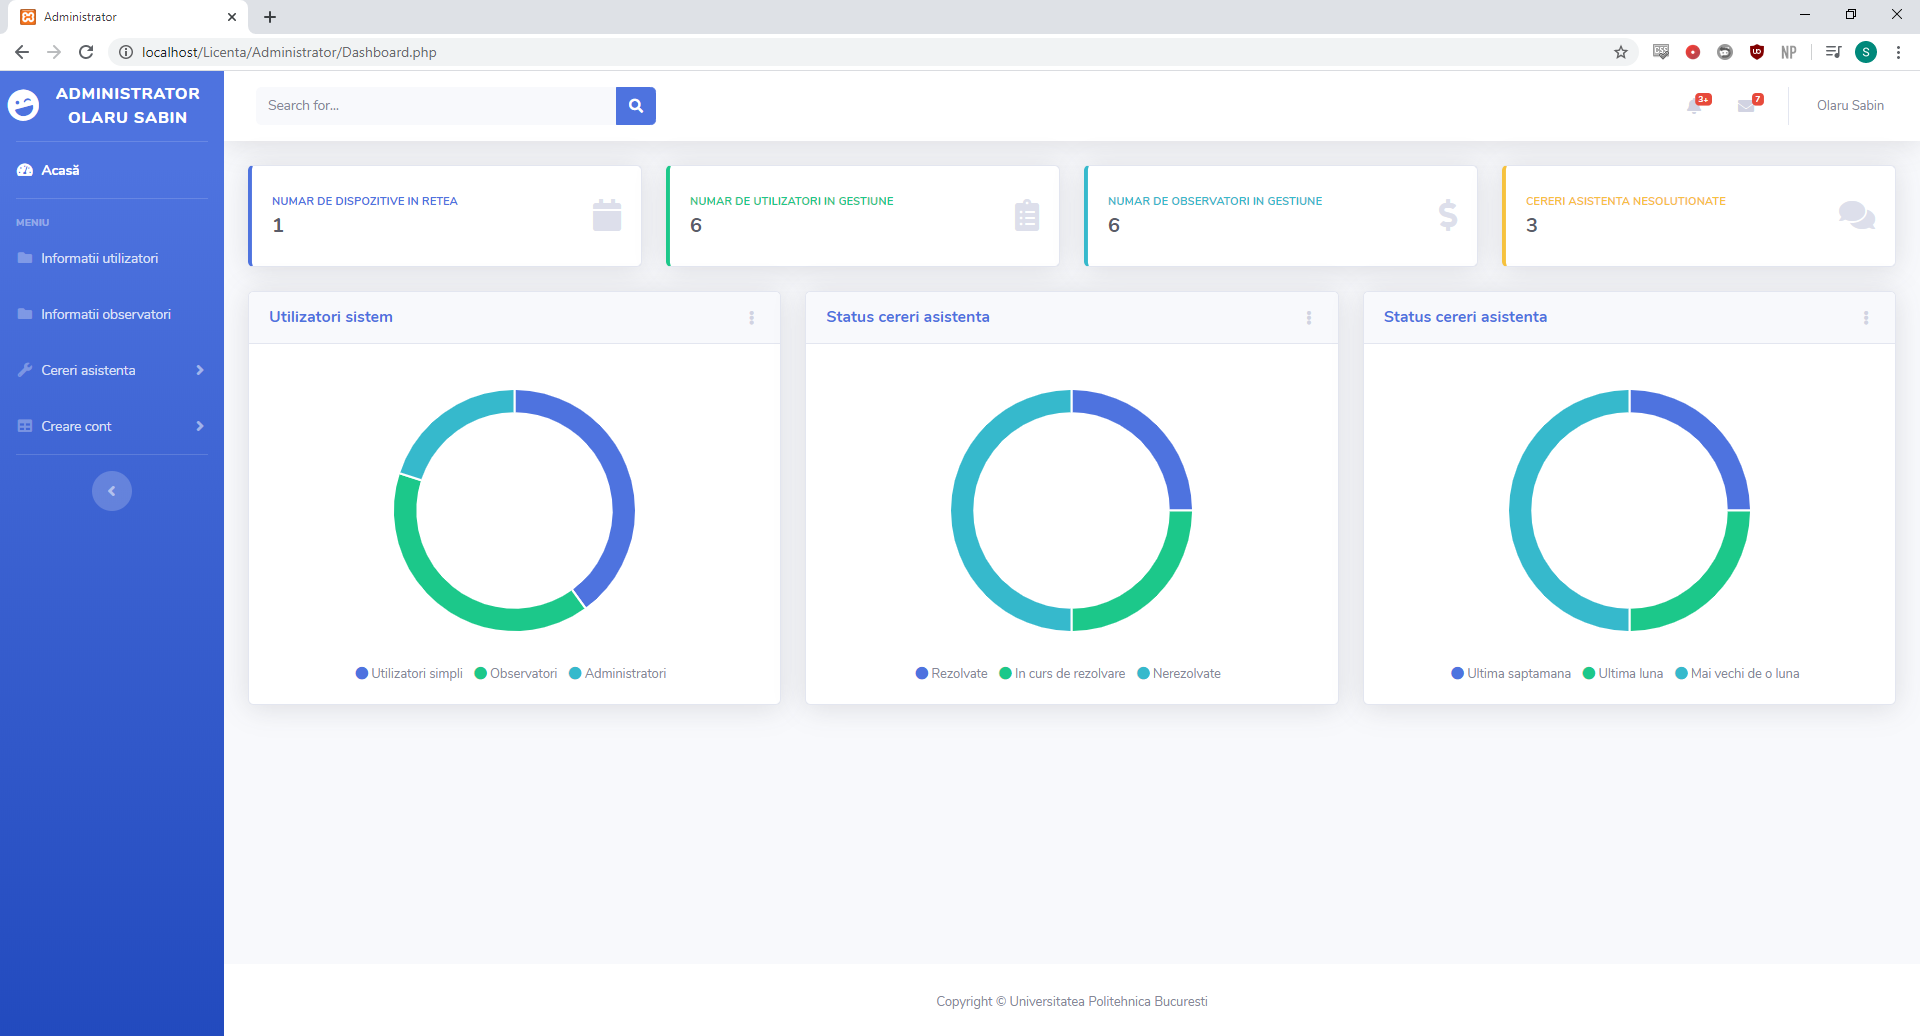
 Administrator Dashboard:
 Application user view:
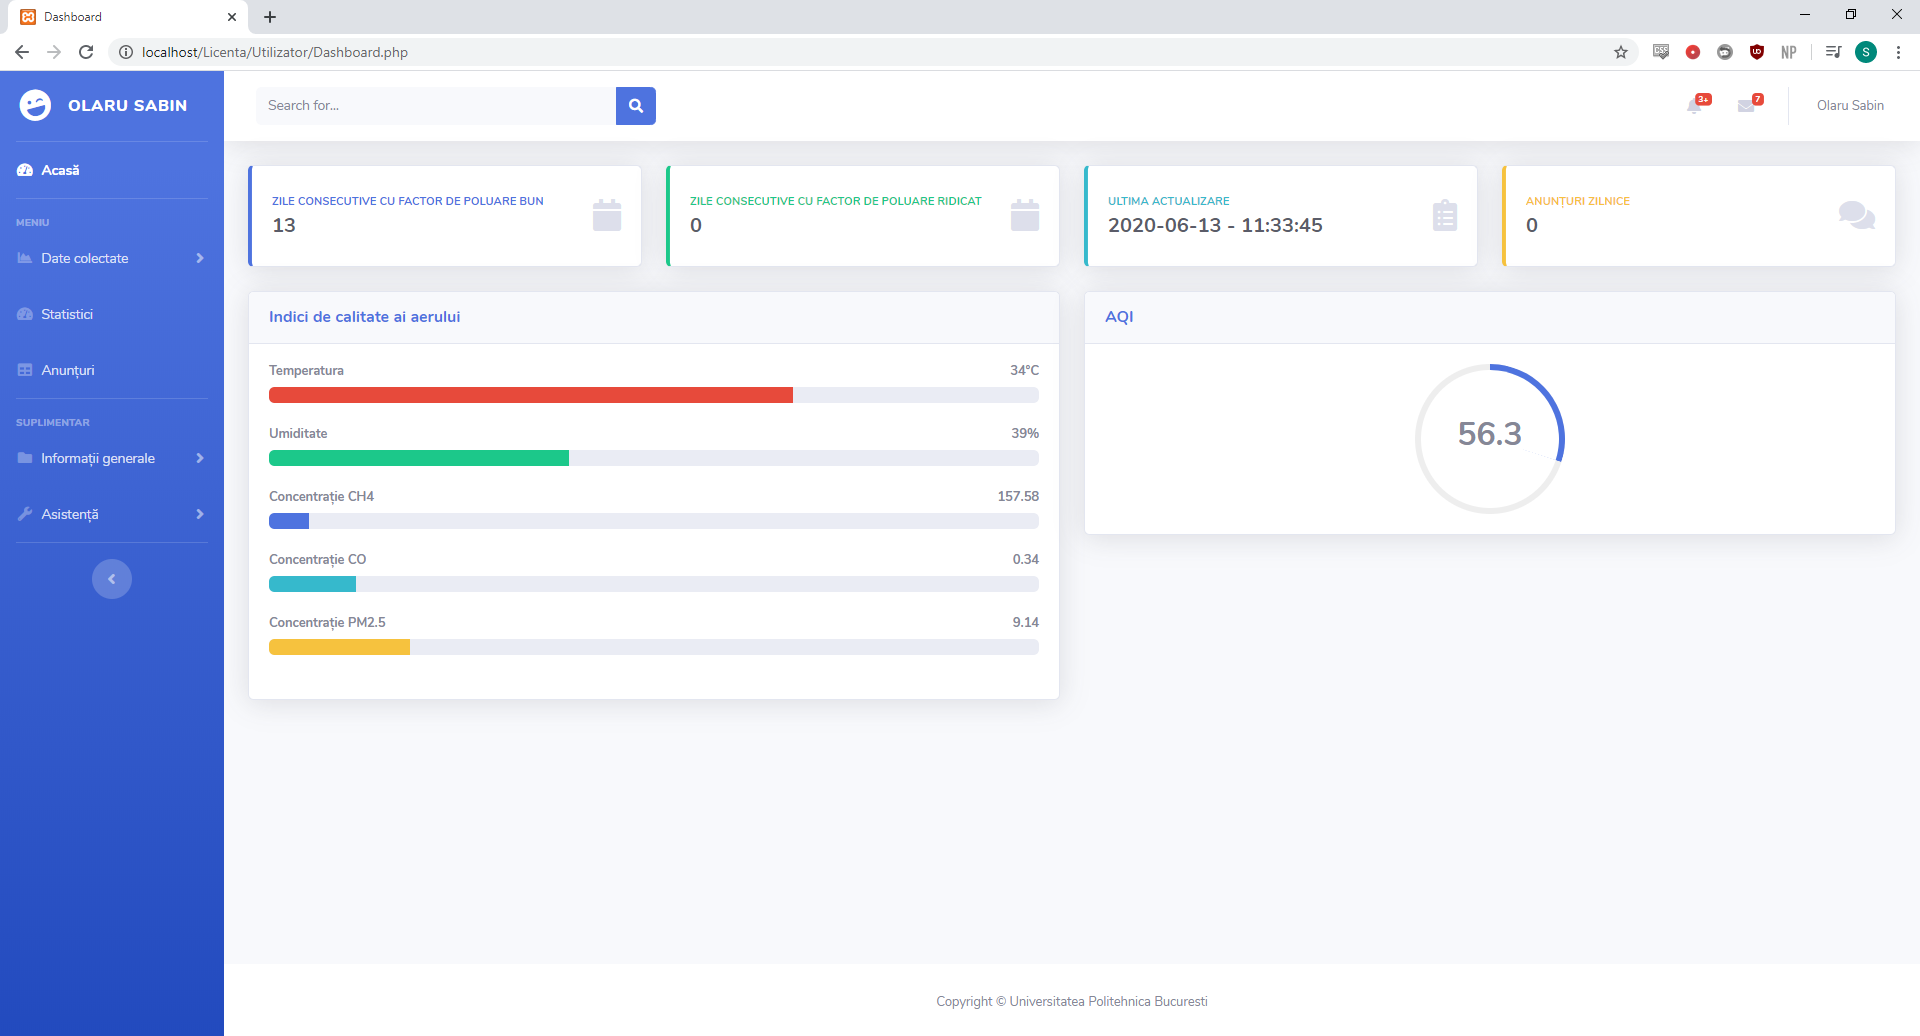
 User Dashboard:
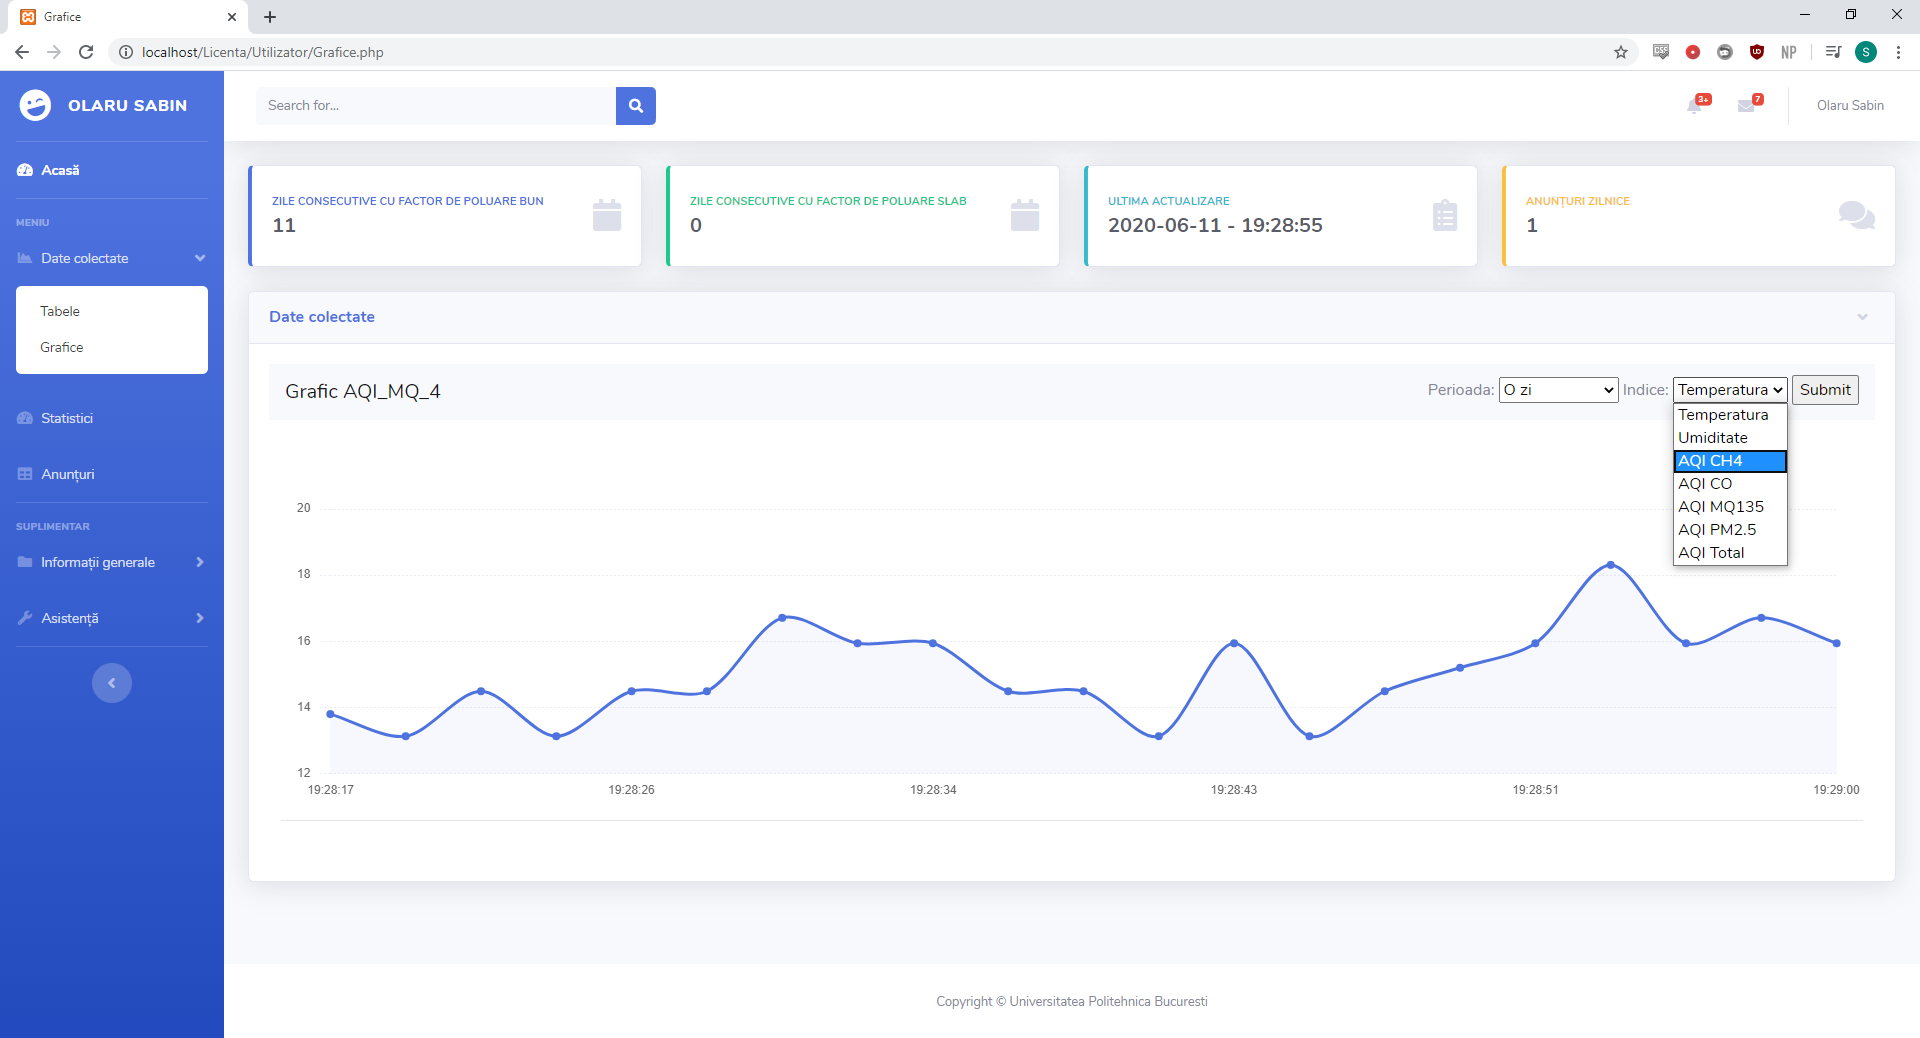
 User data graph visualization:
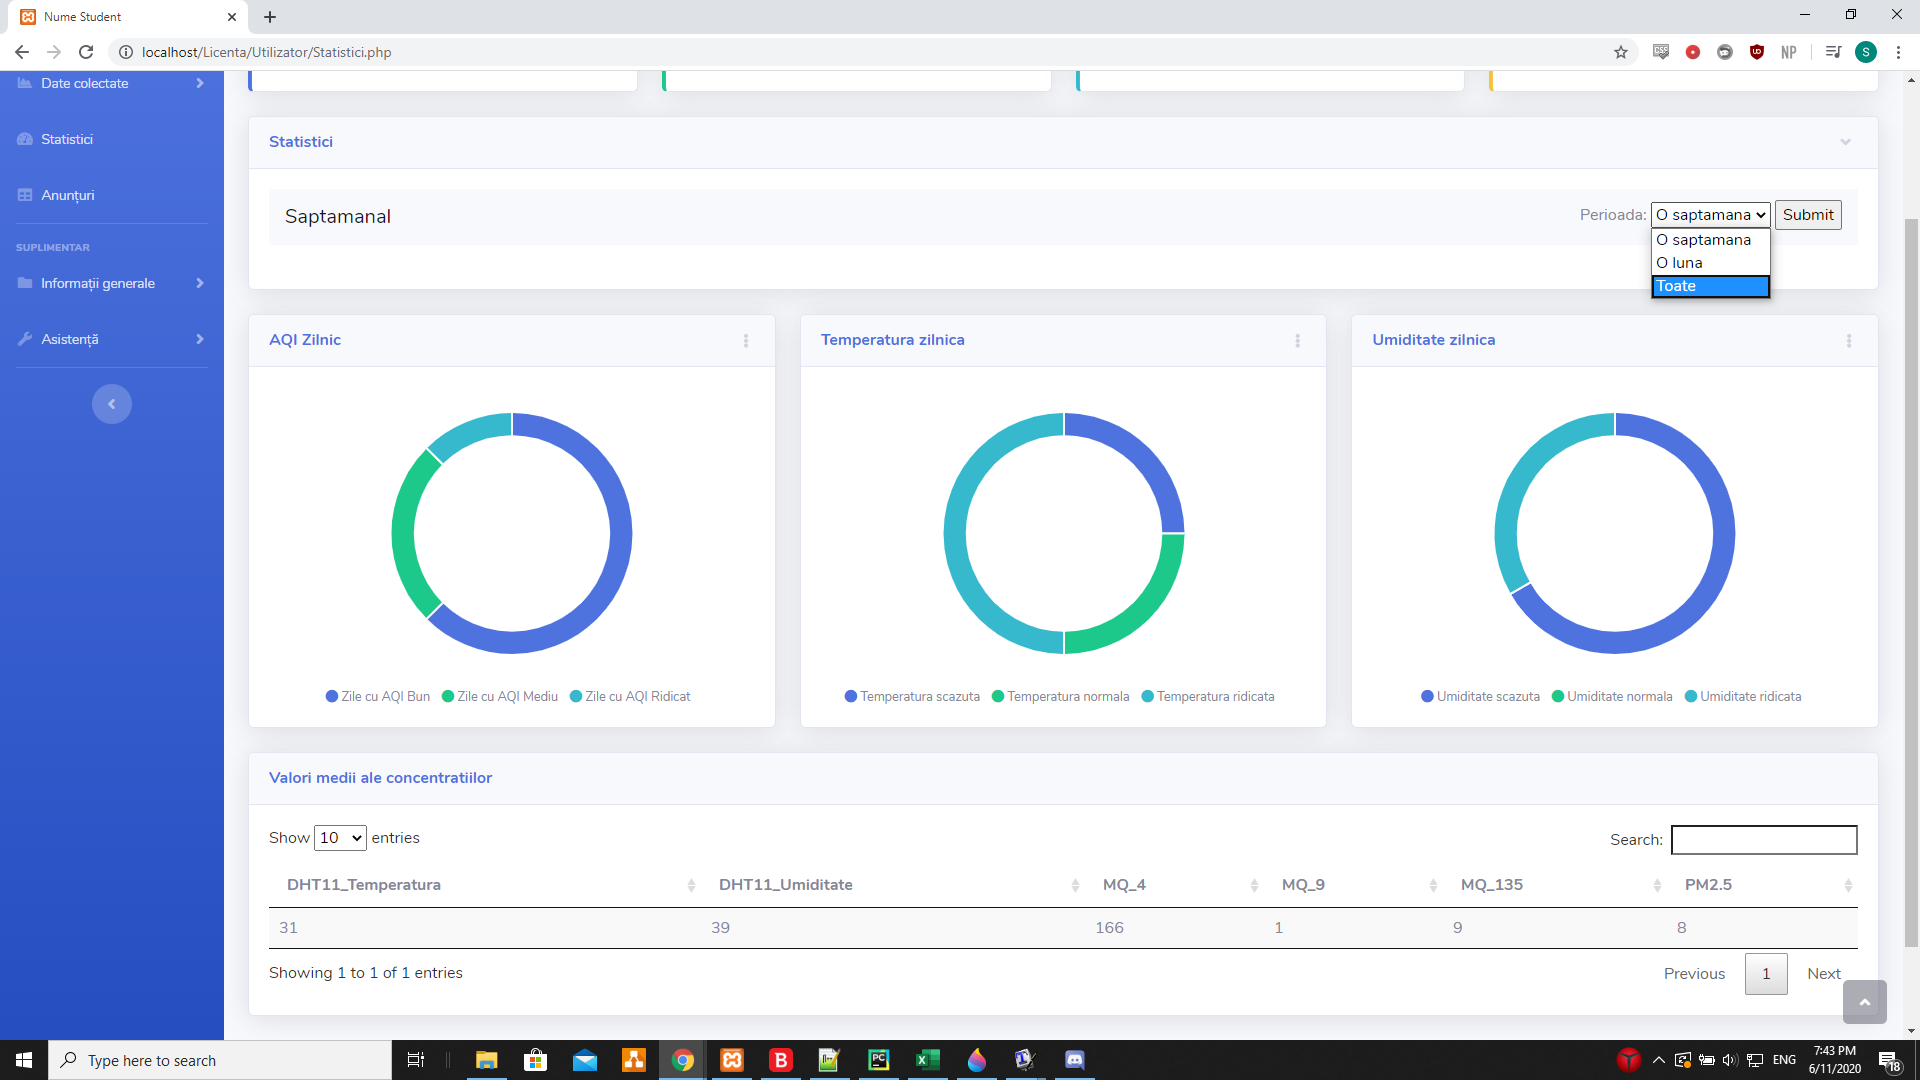
 User statistics visualization:
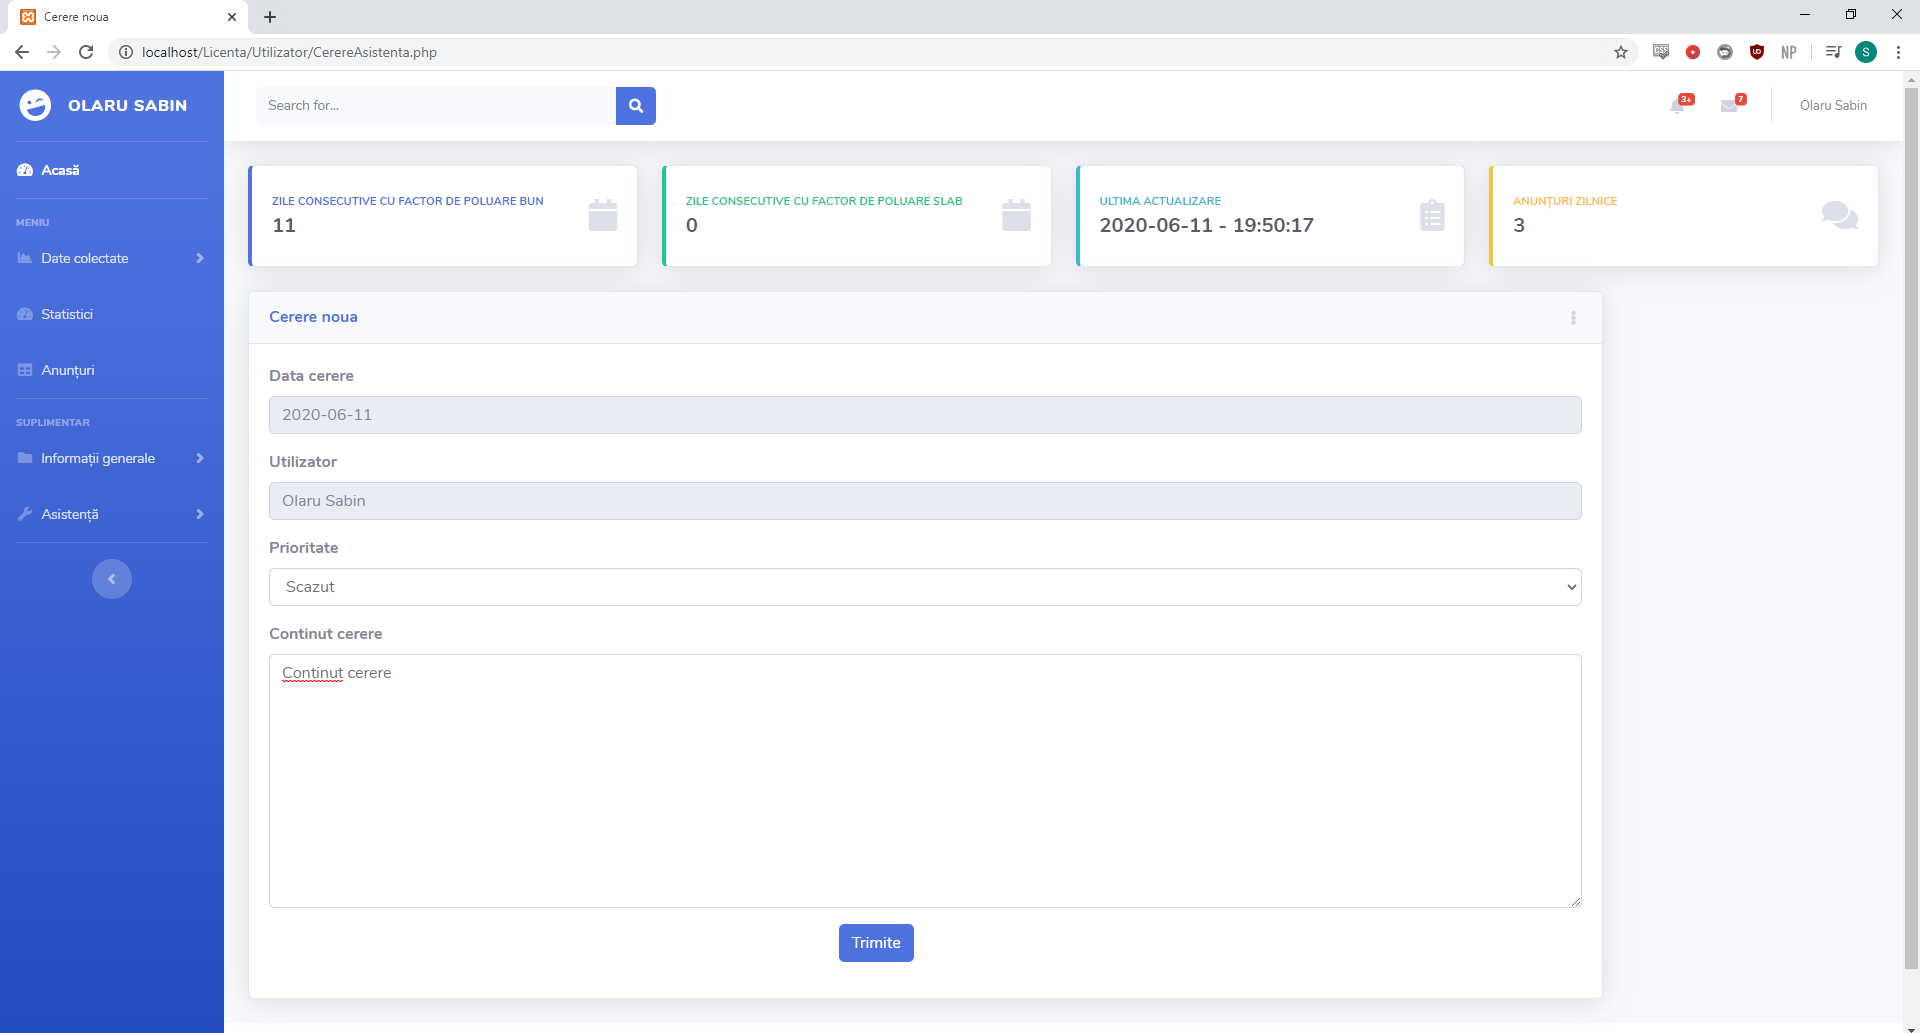
 User assistance request form:
4. Results
Outdoor measurements
The measurements were carried out outdoors, placing the sensor box outside the window of their own house, located on the fifth floor of a ten-story building. An important aspect to note is that the part of the block from which the measurements were made is not oriented towards the boulevard, so the impact of traffic on the measured air quality is lower. had a duration of seven weeks, being performed daily in a number of almost 7000 measurements, totaling a number of 47016 measurements. temperature and humidity:
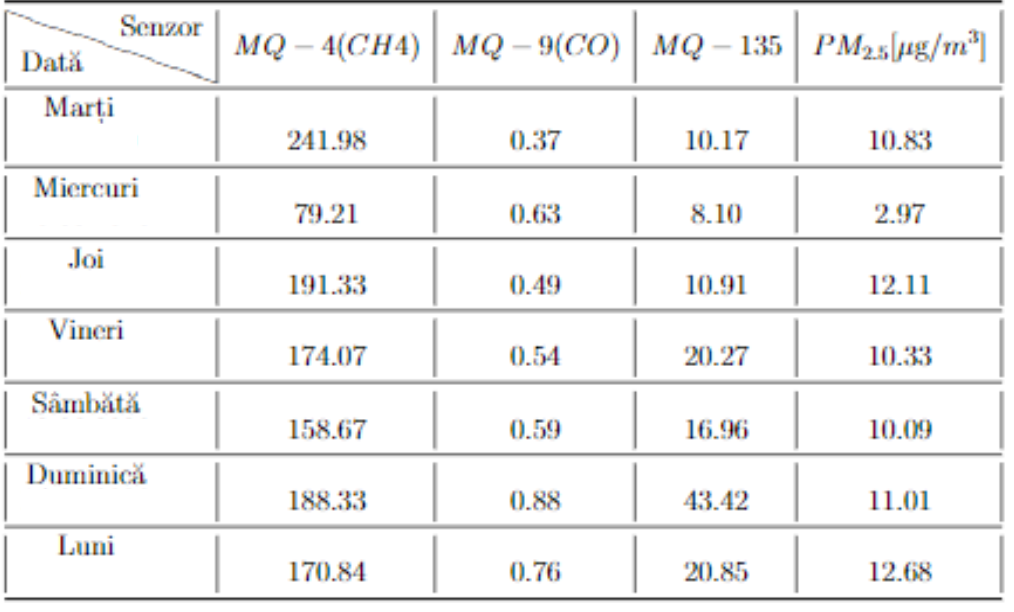
During the sampling period, there were precipitations, atmospheric phenomena which are reflected in the high percentage of measured humidity. The measured daily average concentrations of the pollutants and shown in the following table:
Based on the measured concentrations, the AQI indices were calculated for each monitored pollutant, and then the maxima were designated as the total AQI indices measured. The values of these indices are listed in the following table.
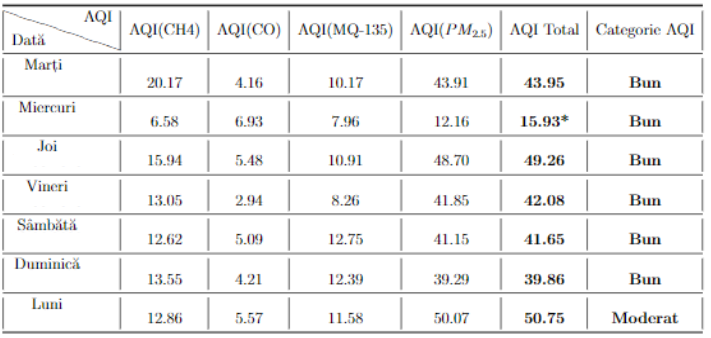
These measurements show a phenomenon that was to be expected in the environment in which the measurements were performed, namely that the main pollutant and the one that gives value of the total AQI mostly is PM2.5 (i.e dust particles in suspension). In the open air, in an urban environment, the phenomenon was to be expected, being a proven subject and brought into discussion by numerous scientific researches. It can also be seen that on Wednesday, the AQI calculated on the basis of the concentration of PM2.5 is significantly lower than in the other days. This result is marked in the table with the symbol * to highlight its particularity. This observation led to the verification of the sampled data and an interval was identified during which the sensor did not work value 0. By removing the erroneous measurements, a new AQI value corresponding to PM2.5 of 42.69 was obtained. This newly obtained value was also considered as the value of the total AQI for the day in question.
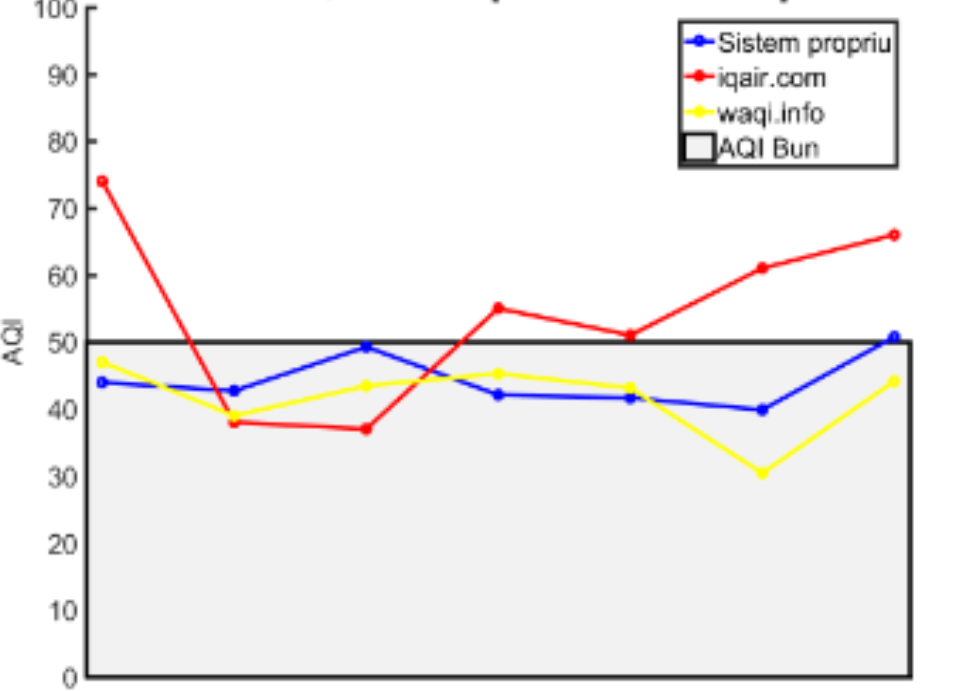
Comparison to existing models
In order to compare the performance of the designed system with existing models, two reference sources were used for the air quality index:
- waqi.info - An online source that monitors air quality in more than 100 Countries with over 30,000 measuring states in 1,000 major cities, which base their AQI calculation on the following pollutants: PM2.5 particulate matter and PM10, ozone, nitrogen dioxide, sulfur dioxide and carbon monoxide.
- iqair.com - A source available online of Swiss origin, which provides information on global air quality, and which provides data from four locations located in Bucharest.
The process of taking data from each source was made differently, due to the different distribution of their measurement stations. Source waqi.info has multiple stations nearby the location where our own measurements were made, but none close enough to be chosen to the detriment of others. Thus, the solution was chosen to take the data from the nearby stations and to average them, obtaining an average index that will be later compared to the data obtained by its own system. The second source, iqair.com, provides a measurement point located close to the location where the measurements were made, and thus being chosen as a reference.
The data collected from these references were collected daily and tried to be as frequent as possible
5. Conclusions and perspectives for further development
Evaluation of the parameters of interest
The technical specifications of the built measurement set are:
- Measurement system weight - 460g
- Measurement system box weight - 452g
- Total weight - 912g
- Dimensions - 33.5cm x 23cm x 16cm
- Autonomy - approx. 21 hours
- Realization cost - approx. 250RON
- Necessities - In addition to pre-charging the external battery, only WiFi connection is required.
Prospects for improvement and further development
Improvements
Although the performance of the realized system is very good, and the parameters of interest have been mainly fulfilled and successfully, there are improvements which could be done to improve the quality of this system even more.
Measurement system power supply
The external battery model that was used in this work is an older model that has been used before, so its capacity is no longer at the original level. Replacing it would lead to an increase of the system autonomy, as well as the decrease of its weight, the model used having a considerably higher weight compared to the new models. An additional solution for the improvement of the system autonomy would be using an alternative method of continuous operation of the sensors, for example turning them on for shorter periods of time in which to perform measurements, and then turning them off at the next predetermined measurement interval. This improvement proposal, however, needs to be carefully evaluated, preferably through experiments, because the sensors, such as the MQ gas, may need a period of prior operation before it can provide meaningful data, as they need to warm up and calibrate. Thus, although autonomy would be improved, the quality of the data provided by the sensors could suffer.
Measured range of indicators
The built-up system does not currently cover all the polluting agents of interest. Although the performance of the system was good, the addition of additional sensors would provide a more comprehensive and detailed picture of the air quality. It should be noted, however, that the addition of new sensors will have the effect of reducing the autonomy and possibly the need to add another breadboard, the current one being used close to its maximum capacity.
Accuracy of data provided by the system
Although the comparison with the existing models showed a good performance of the system regarding the accuracy of the measured data, their calibration, especially in the case of MQ sensors was performed empirically. A more accurate method involves the use of professional apparatus, but the costs of these are high, so that the improvement considered for the development of the work is the use of machine learning techniques. To determine the formulas and correction factors that provide the most accurate data. It has also been pointed out that a correction may also be required in the case of the temperature sensor to cancel out the effect the heat dissipated by the system has on the measurements.
Further development
The desired direction of development of this work is the realization of the improvements mentioned above and the realization of a network formed by systems identical to the built one. For geographical distribution, the installation of each system on a drone is considered , with the weight and the dimensions of the system allowing the implementation of this concept. Based on the measurements, we could then make a three-dimensional representation of the air quality, available in the Web application. On the basis of that, we can then analyze the quality and evolution of the quality of the air in an area. In case of need, the assembly could be relocated to any area of interest, taking into account the portability of the measurement system and the mobility of drones.
6. Bibliography
https://www.who.int/health-topics/air-pollution/
Perry Lea.”IoT and Edge Computing for Architects - Second Edition”. 2020
Networking Technologies, Protocols, and Use Cases for the Internet of Things”. 2017.